Great Depression 2.0? Billionaires Still Selling.
News
|
Posted 07/12/2023
|
2608
The decline in money supply growth has gotten worse in October since turning negative in November 2022 for the first time in 28 years. This downward trend from the unprecedented highs of the past two years indicates a significant shift. Since 2009, the money supply has increased 186%, so perhaps it needs to keep shrinking. That being said, will all investments be safe if it does keep on this path? Let's have another look at what billionaires are doing:
To update our recent story about billionaires selling their shares:
- Mark Zuckerberg has been selling Meta shares for the first time in the last two years.
-According to Bloomberg, he sold Meta Platforms Inc. stock almost every weekday this year.
- The founders of Google, Brin and Page, began selling off shares in May. These were their first sales since 2017.
- The billionaire Walton family (Walmart) has also been selling their shares:
-Alice L. Walton sold 263,463 shares of Walmart stock in a transaction on November 22nd. A total transaction of $40,776,168.
-Jim C. Walton sold 420,000 shares of the company’s stock in a transaction that occurred on November 29th at a whopping value of $65,536,800.
- The richest Americans have sold $42.9 billion of stock this year – more than double of what they sold in all of 2020.
Do they see trouble on the horizon? There are potential problems coming from the contracting money supply. The latest data reveals twelve consecutive months of negative money supply growth, with October 2023 witnessing a year-over-year decline of –9.33 percent. This slight improvement from September's –10.49 percent still significantly lags behind October 2022's 2.14 percent. The persistent negative growth, nearing or falling below –10 percent for the eighth consecutive month, marks the most substantial money-supply contraction since the Great Depression. Prior to this, for at least sixty years, no month had seen a year-over-year decline in the money supply by more than 6 percent.
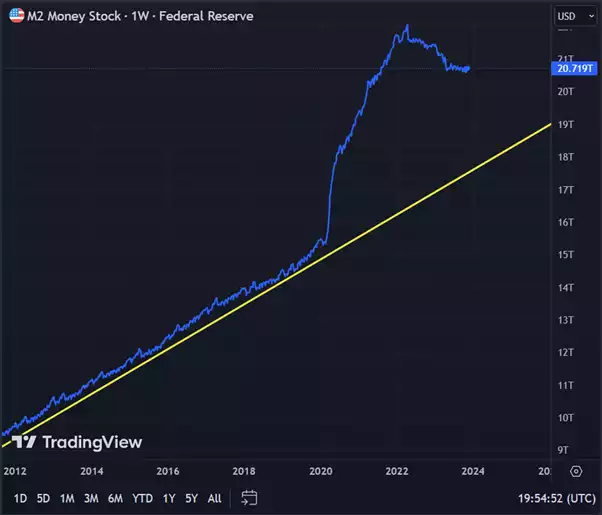
The current contraction is noteworthy because the money supply rarely decreases in modern times. Since the peak in April 2022, the money supply has shrunk by $2.8 trillion -- proportionally the largest fall since the Depression. Despite this, the money supply remains significantly above the trend observed from 1989 to 2009. Returning to this trend would require a further drop of at least $3 trillion (15 percent), bringing the total below $15 trillion. As of October, the total money supply is still up 32 percent ($4.6 trillion) since January 2020.

-Notice how high from the trend the money supply has risen since 2020. Now we're left with the combination of high prices and a shrinking money supply.
The slowdown has already impacted the economy, which can be seen in the manufacturing sector and from various economic indicators. Lending conditions are tight and have contributed to a surge in commercial bankruptcy filings. The average 30-year mortgage rate hit 7.62 percent in October. That's the highest since November 2000. The surge in bankruptcy filings, both commercial and individual, along with rising costs of living and housing affordability concerns, point towards an unfolding economic crisis.
As the Federal Reserve cautiously reduces money creation after a decade of easy monetary policies, the challenges of sustaining economic stability without reigniting inflation become apparent. However, the consequences of this shift are already impacting various sectors, signalling the bursting of an economic bubble and the need for a more sustainable economic model based on saving, investment, and realistic interest rates.
Regular readers will note this is in seeming stark contrast to our monthly Global Liquidity Index report a couple of weeks ago. Herein lies the perverse distortions in this global market. Whilst the GLI is most definitely showing an uptick in liquidity, the key word is Global. Whilst the U.S. is still in tightening mode via the M2 metric, and that most certainly is putting pressure on the economy that is seeing these billionaires bailing out; they are also quietly injecting liquidity via the likes of the BTFP bank bailout program we discussed last week. More broadly, global liquidity has been pouring in via the likes of China and Japan. The U.S. is stuck between a rock and a hard landing where they know they need to start easing but with inflation still high, they can’t do so without a clear excuse - say a market crash and/or recession...The tightening of M2 looks almost certain to bring that on. So whilst the two metrics seem at odds the end result is the same; more liquidity and higher gold prices. The smart money is bailing out of shares and you may well heed their warning.