Global Liquidity, Gold and Bitcoin: November 2023 Update
News
|
Posted 24/11/2023
|
3930
Today we bring you the latest Monthly Update released by our Chief Economist, Chris Tipper. We highlight a few of the key charts he analyses and provide the link to the full presentation which we encourage you to watch. There is a lot of value here for anyone looking to understand specifically how Global Liquidity is driving the Gold and Bitcoin price, combined with actionable trade ideas to take advantage of the unfolding opportunity.
This presentation follows on from the similar update provided last month. The idea is to keep you updated over the entire cycle as it unfolds, with the progression and changes identified each month. The framework has proven successful for taking optimal advantage of the Global Liquidity Cycle, which is becoming increasingly important for anyone looking to outperform the rate of worldwide debasement of fiat currency that is underway. As Chris is demonstrating the practical framework and trading strategy that he personally trades, he tends to focus on Bitcoin specifically, but makes the point that the analysis works equally as well for Gold (as both Gold and Bitcoin can be considered as “Monetary Inflation Hedges”) so there is a bit for everyone, regardless of whether you are interested in the outlook for precious metals or crypto.
Some Key Highlights:
Total Global Liquidity continues on a path upwards over time, but there are predictable cycles within the longer term moves
Even though the broader trend for liquidity will always remain increasing over time (more debt to service), there are predictable cycles within the creation of all this new currency that are quite consistent. Governments and central banks go through periods of slowing down the production of new liquidity and speeding it up, attempting to smooth out booms and busts in their individual economies.
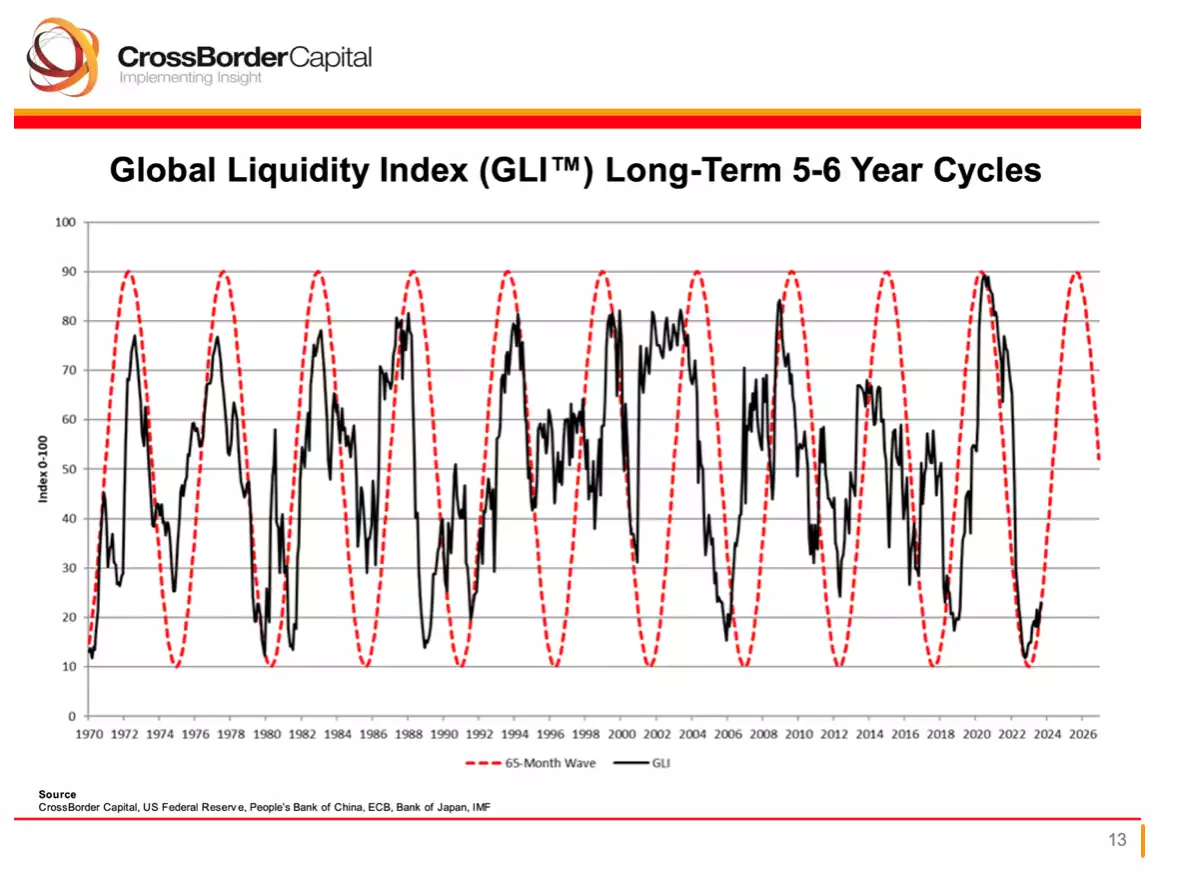
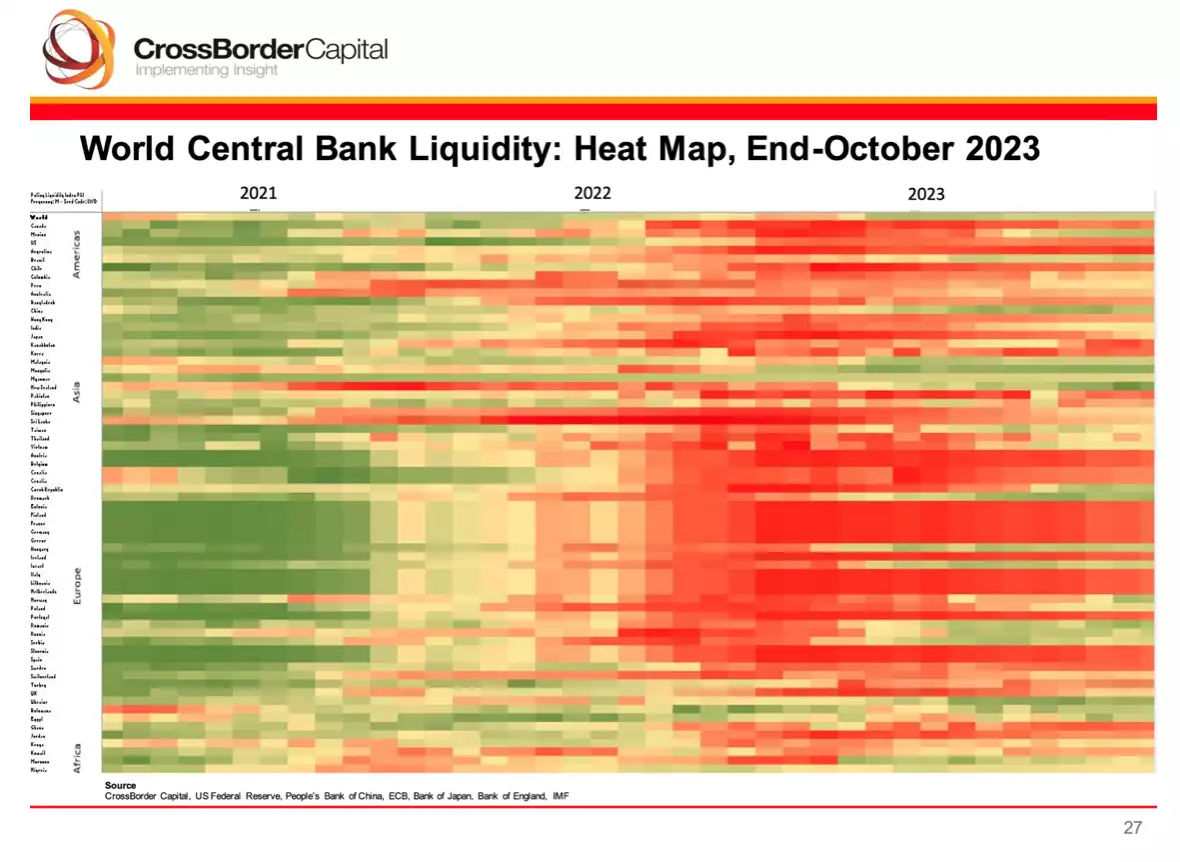
We are currently heading into a new cycle of more Global Liquidity flooding into the system
This heat map shows the cycle in motion and what it looks like in reality. The area of green dominance in 2021 shows the period of rapid expansion that was underway on the back of stimulus spending coming out of COVID, while the area of red dominance in 2022 shows the period of rapid contraction as Quantitative Tightening was implemented. We are now starting to come out of the period of rapid contraction and entering a new “green” period of liquidity expansion.
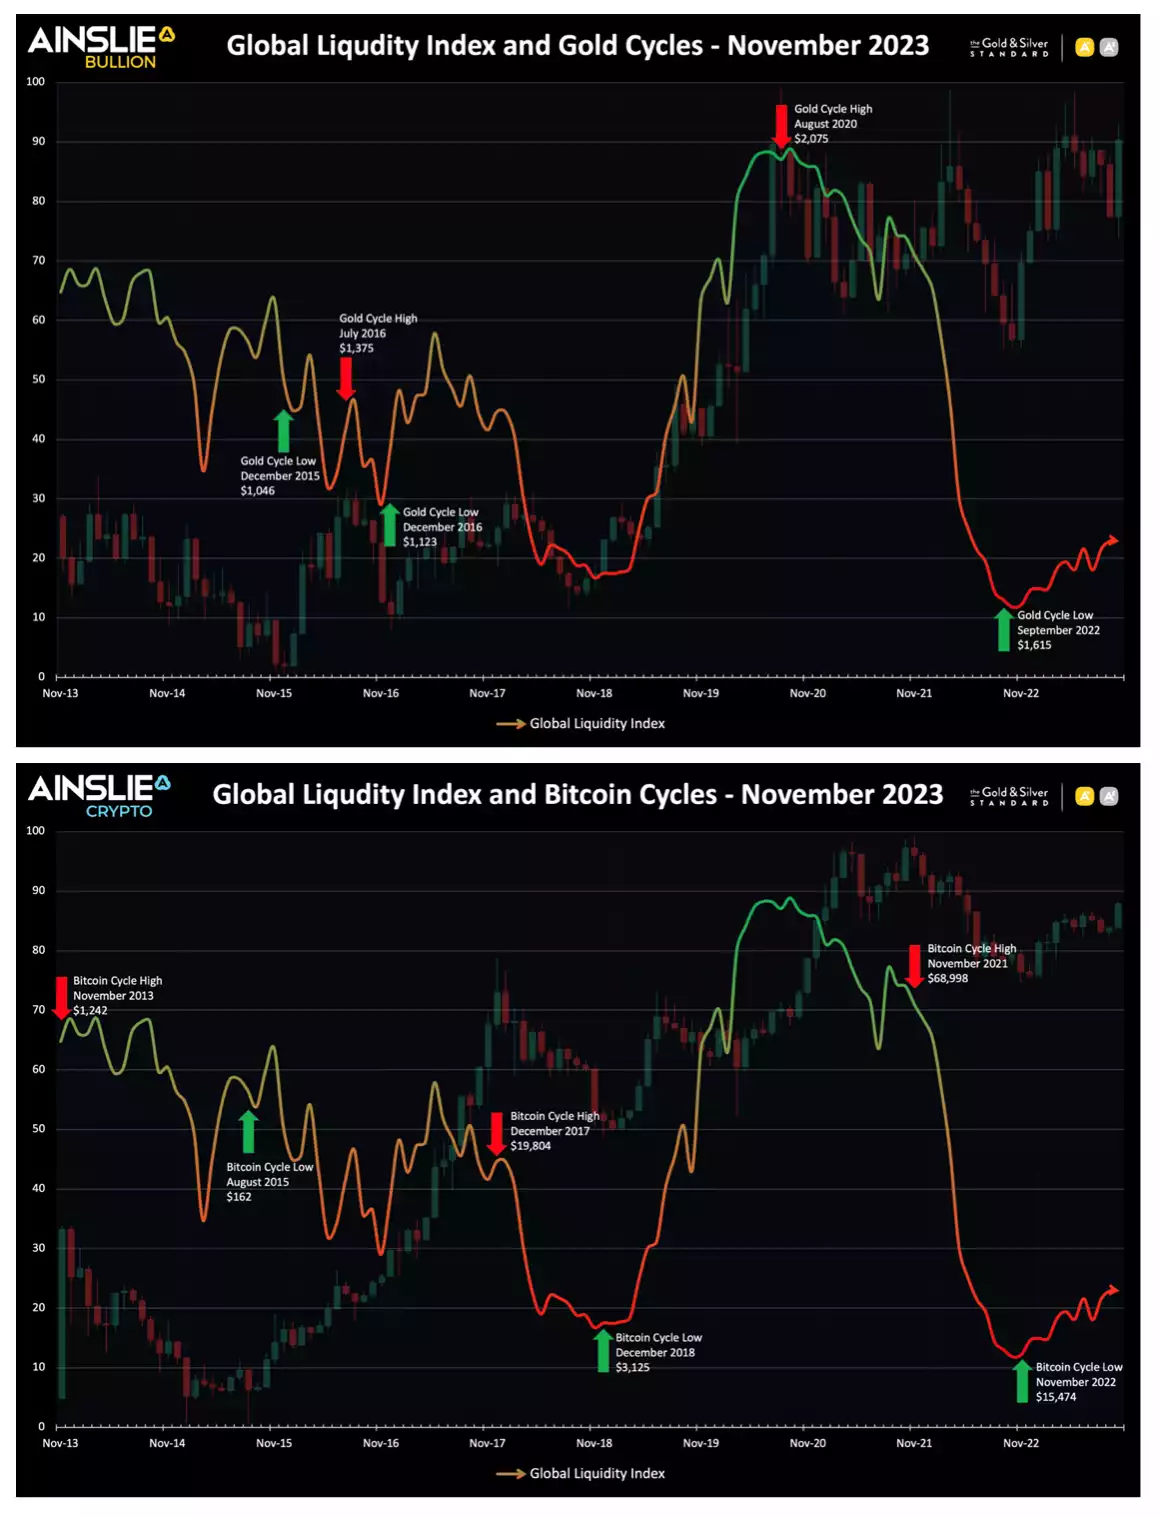
Gold and Bitcoin are the best assets to trade against the Global Liquidity Cycle
Some assets are better than others at more accurately reflecting the Global Liquidity Cycle. Even though most assets go up over time in dollar terms as more total liquidity is added to the system, Gold and Bitcoin act as Monetary Inflation Hedges, which means they are among the best assets to specifically select to trade to take optimal advantage of the cycle. You can see in these charts the longer-term correlation between the price of Gold and Bitcoin (the candle bars in the background) to the overlayed Global Liquidity Cycle Index line. This correlation is increasing in recent years and the cycle is becoming more pronounced and undeniable as global government debt has started to spiral out of control.
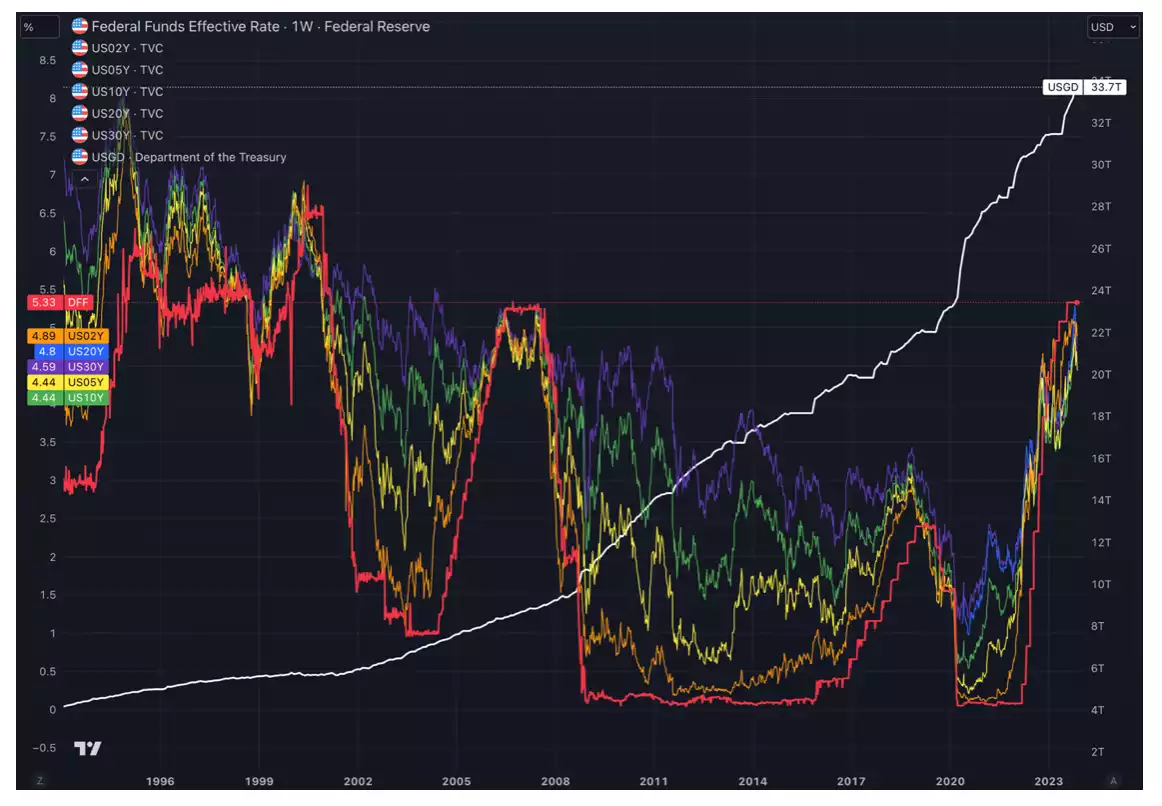
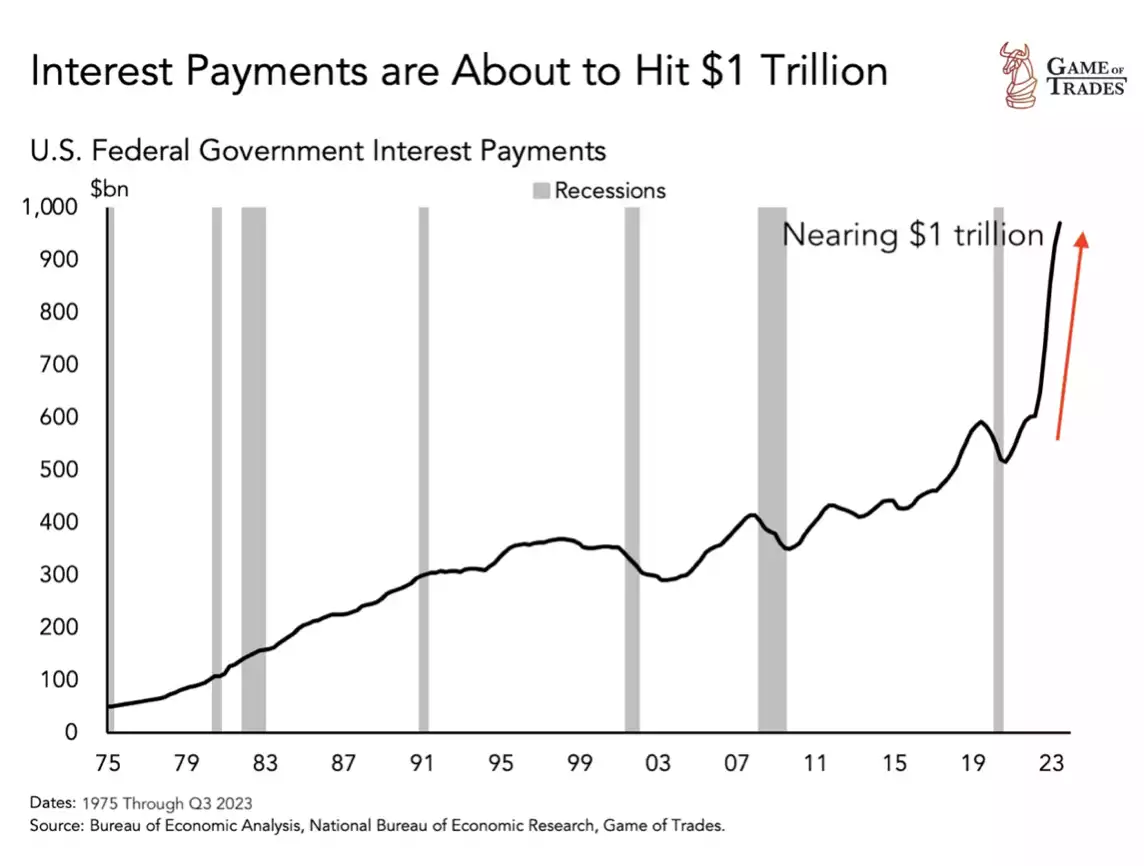
Global debt, highlighted through US Government Debt, is starting to increase exponentially, and so are the interest payments required to service that debt
When you look at US Government Debt (and all countries are following the same playbook, the US is just the most influential), it has started to go parabolic resulting in increasing risks for the entire global economy. We are now at a point of certainty that more monetary inflation will come as the interest payments on the debt alone ensure more liquidity must be injected to keep the entire system from collapsing. This is why everyone needs to be paying attention to the role of Monetary Inflation Hedges (specifically Gold and Bitcoin) to have any chance of their portfolio keeping up with the further currency debasement ahead.
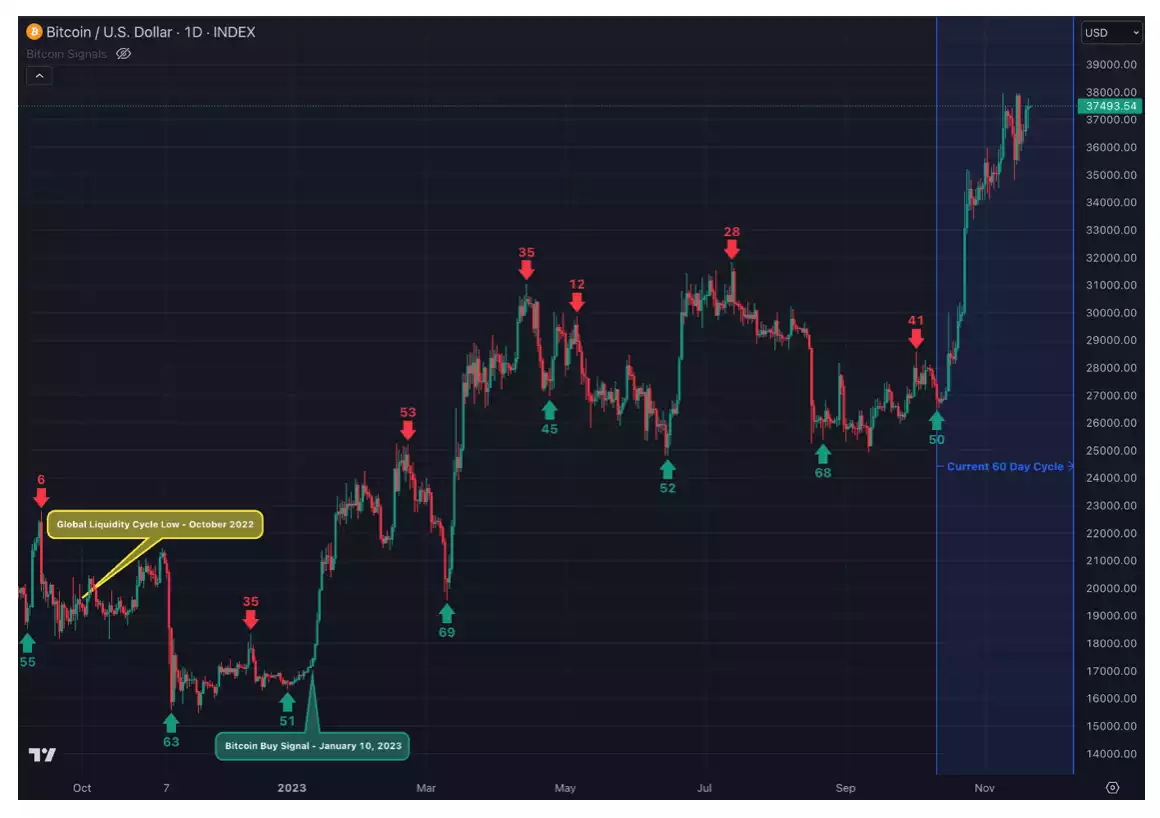
With the right tools to understand where we are in the cycle, the aim is to not only keep up with monetary inflation, but outpace it with significant profit
January 10, 2023: Bitcoin Buy Signal at $17,179 USD. Current Gain of 118.1% over the past 315 days - as at the open of Tuesday’s candle ($37,469 – 21/11/23), which is 136.9% annualised.
Watch the full presentation with detailed explanations on our YouTube Channel here: (https://youtu.be/J99H3muvKZU)
We love feedback, so feel free to leave any questions or comments in the YouTube channel for us to follow up on! See you next month for the ongoing analysis of Gold, Bitcoin and the Global Liquidity Cycle and we hope that it helps you to better understand some of the key drivers of the cycle to take optimal advantage of the opportunity presented for yourself.