Why the U.S. is Broke and the Empire Falls
News
|
Posted 12/03/2024
|
5676
The news today sees our government trying to reconcile the cost to care for all the baby boomers with less workers paying for more retirees when they are already ‘tapped out’. Whilst a challenge to be sure, it pales against the U.S.’s future liabilities dilemma and hence maybe why they don’t even put it on their books… It’s a ‘future’ problem. No its not.
For the Australian context, this today from the ABC:
“A total of $23.6 billion was spent on aged care in 2020-21, which increased to $24.8 billion in 2021-22 and $27.1 billion last financial year in 2022-23, with aged care expenditure expected to reach $42 billion by 2026-27.
The government currently funds 75 per cent of residential aged care and 95 per cent of home care, a level that the taskforce's report said was "not an optimal or fair mix".”
That is a massive increase at a time when deficit spending is already rife. And that is just aged care. But if you think that is bad…
The latest official Financial Report of the United States Government (February 2024) paints a dire picture for the world’s biggest economy.
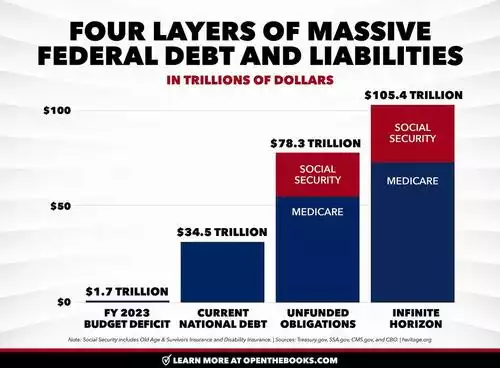
First let’s set the scene. The U.S. government currently has a debt of $34.5 trillion. It is adding to that at a rate of $1-2 trillion every year through spending more than they receive. The last fiscal year saw a $1.7 trillion deficit, this year about the same. The thing is, despite every business in the U.S., under the Generally Accepted Accounting Principles (GAAP), having to list all liabilities, contingent or otherwise, on their balance sheet, the U.S. government seems to think it is different. And so, as grotesque as $34.5 trillion ‘official debt’ is, it is but a fraction of their real liabilities. Consider Exhibit A from data the very U.S. Treasury themselves just released…

We’ve spoken to the first 2 bars already. The third bar “Unfunded Obligations” illustrates the fact that over the next 75 years the U.S. Treasury estimates they will spend $215.7 trillion on Social Security and Medicare payouts to beneficiaries. In that same period, collections (mostly through payroll taxes) are estimated at only $137.4 trillion. That is a $78.3 trillion shortfall. The very same report says this can only be rectified through increased borrowing, increased taxes, and reduced benefits. Let’s face it, none of those are politically palatable except more debt which the masses don’t ‘get’ (yet). But is gets worse…
The report points out a sad fact, and that is the above isn’t actually correct. In reality that 75 year period doesn’t include the years when most of the Social Security and Medicare cost will be paid. They call this the ‘Infinite Horizon’ projection and it sees the already eye watering $78.3 trillion balloon to $105.4 trillion. They then talk to “Future” participants, who are now younger than fifteen or even still in the womb, will use $69.9 trillion more than they contribute. Combined, that is a simply unfathomable $175.3 trillion shortfall not accounted for.
Lets just put that into perspective. The GDP of every nation on earth is $104.5 trillion. In the 236 years since the U.S. Constitution was written, the U.S. has spent about the same amount even adjusted for inflation! All the gold ever mined is only around $18 trillion.
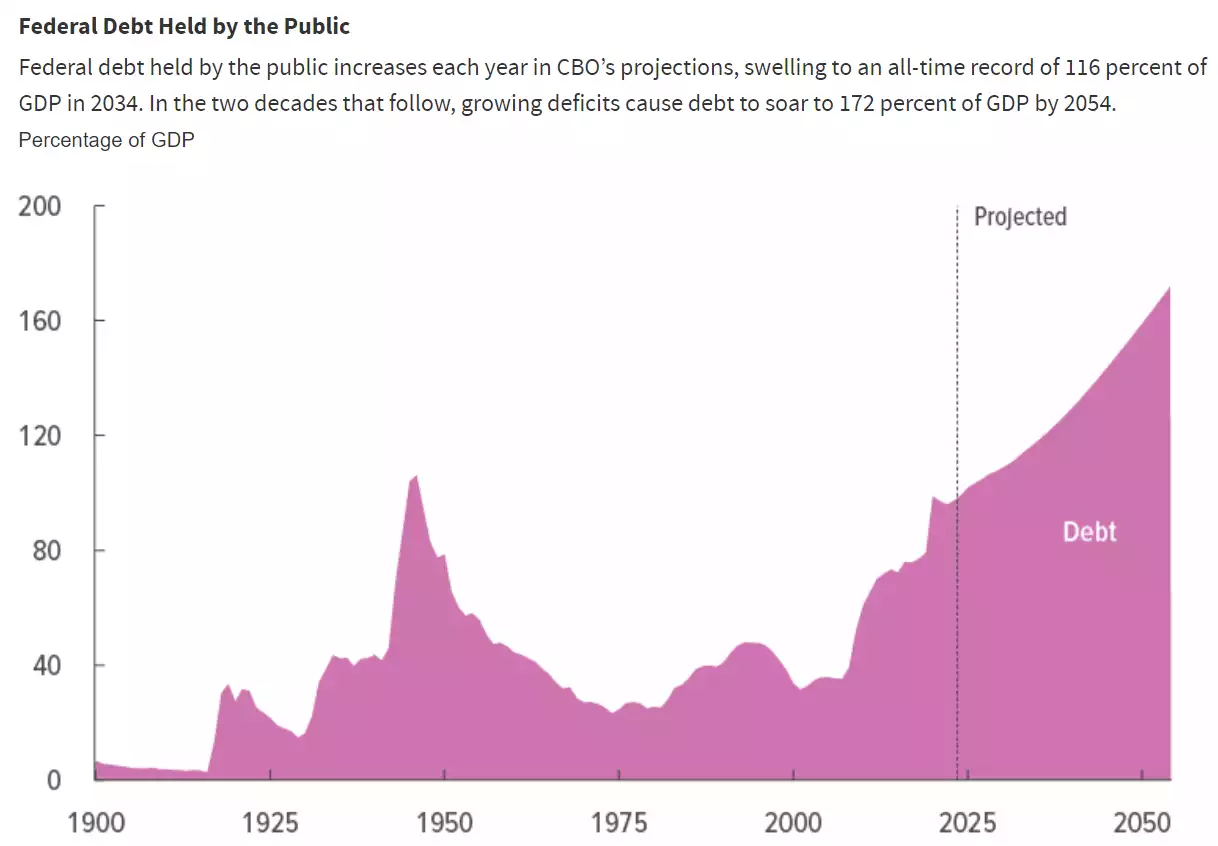
What this likely fails to consider too is the ballooning cost of actually servicing the increasing debt burden. As we have written repeatedly, that is currently $1.1 trillion per year, higher than defence spending and racing up on the very same Social Security and Medicare costs discussed. Yesterday we discussed how the U.S. and Australia are importing over 600,000 consumers and tax payers to keep their economic Ponzi schemes alive. The U.S. allowed 3.8m new migrants in just last year. In all likelihood, as they continually underestimate their deficits and immigration, the above numbers will prove underdone. As a final reminder of where this goes, the following is from the latest (Feb24) official The Budget and Economic Outlook: 2024 to 2034 report from the U.S .Congressional Budget Office…

From that report:
Projections at a Glance
The Federal Budget
The deficit totals $1.6 trillion in fiscal year 2024, grows to $1.8 trillion in 2025, and then returns to $1.6 trillion by 2027. Thereafter, deficits steadily mount, reaching $2.6 trillion in 2034. Measured in relation to gross domestic product (GDP), the deficit amounts to 5.6 percent in 2024, grows to 6.1 percent in 2025, and then shrinks to 5.2 percent in 2027 and 2028. After 2028, deficits climb as a percentage of GDP, returning to 6.1 percent in 2034. Since the Great Depression, deficits have exceeded that level only during and shortly after World War II, the 2007–2009 financial crisis, and the coronavirus pandemic.
Debt held by the public increases from 99 percent of GDP at the end of 2024 to 116 percent of GDP—the highest level ever recorded—by the end of 2034. After 2034, debt would continue to grow if current laws generally remained unchanged.
Outlays in 2024 amount to 23.1 percent of GDP and stay close to that level through 2028. After 2028, growth in spending on programs for elderly people and rising net interest costs drive up outlays, which reach 24.1 percent of GDP by 2034.
Revenues amount to 17.5 percent of GDP in 2024, decline to 17.1 percent in 2025, and then climb to 17.9 percent of GDP by 2027 after certain provisions of the 2017 tax act expire. Revenues remain near that level through 2034.”
How exactly does this not end in a financial and social crisis? To be frank, 75 year projections are farcical regardless. There is simply no way this lasts that long. The day of reckoning is fast approaching. The Empire must fall, like all before it. Only money outside this system survives and indeed thrives, as it has for 5000 years.