Shocking Gold-to-Silver Ratio and the Undervalued Potential of Silver
News
|
Posted 20/10/2023
|
4921
Another day another new AUD all time high for gold, hitting $3125. As we explained yesterday, this is as much about the perilous US bond market as it is about the 2 wars raging – i.e. it feels more structural and constructive for further gains. As we explained here on Wednesday, it also looks like the beginning of a bull market not the top. As gold takes off, off a high gold silver ratio, history tells us that’s when the silver price hits the nitro button….
As far as precious metals go, gold has been the household name as a store of value. However, investors have been increasingly turning their attention to silver, and doing it for one very interesting reason: The gold-to-silver ratio. It's currently 86.2, and garnering heavy attention as investors look for safe havens from the global economic and military situation.
How to Analyse the Gold-to-Silver Ratio
The gold-to-silver ratio (often called the GSR) simply represents how many ounces of silver it takes to buy one ounce of gold. Historically, this ratio has fluctuated, reflecting economic, geopolitical, and market dynamics. Traditionally, the ratio has hovered around 15:1 to 20:1 in times of financial stability. However, in recent years, this ratio has widened significantly, creating a potential opportunity for investors and traders. If the GSR returned to even 20:1, that would mean one ounce of silver would be worth $156 Australian Dollars at the time of writing (compared to around $36).
Contraction
Throughout history, the gold-to-silver ratio has been a vital indicator for investors as civilisations used both gold and silver (real money) for thousands of years. In the modern era, especially in times of economic uncertainty, this ratio has tended to contract, meaning a rise in the value of silver compared to gold. So far, the aforementioned drivers have had a potent effect on gold, helping it reach all-time-highs in Australian Dollars, but it has yet to move silver similarly.
Silver: The Undervalued Asset?
1. Industrial Demand:
Silver boasts extensive industrial applications, from electronics to renewable energy technologies. Its conductivity, malleability, and durability make it indispensable in the modern world. As industries continue to advance, the demand for silver in manufacturing and green technologies is set to rise, driving up its value.
2. Investment Potential:
Silver, often referred to as “poor man’s gold,” offers an affordable entry point for investors looking to diversify their portfolios. As the gold-to-silver ratio remains historically high, investing in silver presents an opportunity for substantial outperformance gains if the ratio contracts. If it contracts as much as it has in the past, we could be seeing a dramatic repricing to the upside.
3. Recent Supply Constraints:
The supply of silver is constrained due to declining ore grades and decreased exploration efforts. Unlike gold, which is often recycled, silver is consumed in various industrial processes, further limiting its supply. As demand continues to outpace supply, silver could be looking at a significant rise.
4. Market Volatility Hedge:
Silver, like gold, serves as a hedge against market volatility and currency devaluation. Its dual role as an industrial metal and a precious metal enhances its resilience during economic downturns, making it a reliable backup in times of uncertainty.
Seizing Opportunities
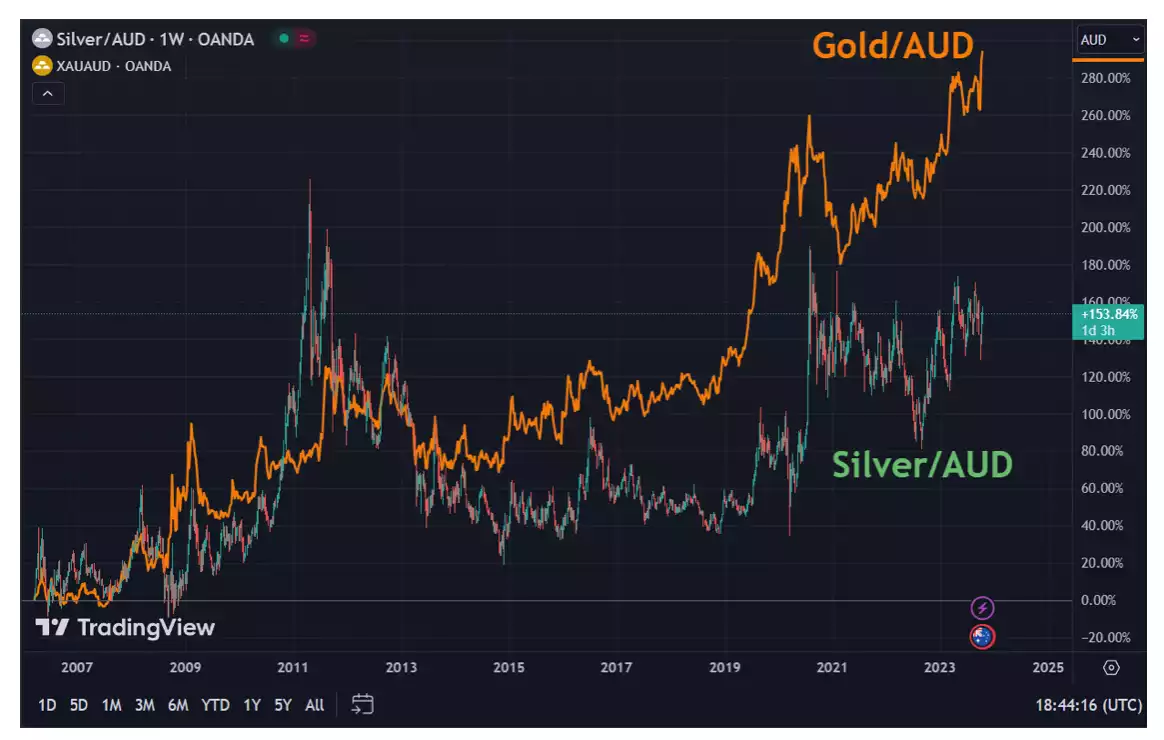
For investors seeking to capitalise on the undervalued potential of silver, one major key can be to utilise the GSR and catch silver at oversold levels. Although not a guarantee, one can see a clear pattern of divergence and convergence between the two metals. Gold appears to often be the initial mover, leaving silver in the dust until investors begin hunting for new opportunities. This eventually can lead to the silver price being tugged into closer alignment. Looking at the above chart of Gold/AUD VS Silver/AUD, do you think it's time for a contraction?
Remember you can watch the GSR easily on our website. It’s always displayed on the price ticker at the top of the site and you can see charts of it but clicking on the gold coloured Charts & Prices button to the right of the ticker, selecting Technical Charts and then Change To the XAU/XAG chart per below:
