Global Liquidity, Gold and Bitcoin
News
|
Posted 18/10/2023
|
3489
Something a bit different today on the back of the latest Monthly Update released by our Chief Economist, Chris Tipper. We highlight a few of the key charts he analyses and provide the link to the full presentation which is well worth a watch. As Chris is demonstrating the practical framework and trading strategy that he personally trades, he tends to focus on Bitcoin specifically, but makes the point that the analysis works equally as well for Gold (as both Gold and Bitcoin can be considered as “Monetary Inflation Hedges”) so there is a bit for everyone, regardless of whether you are interested in the outlook for precious metals or crypto.
Some Key Highlights:
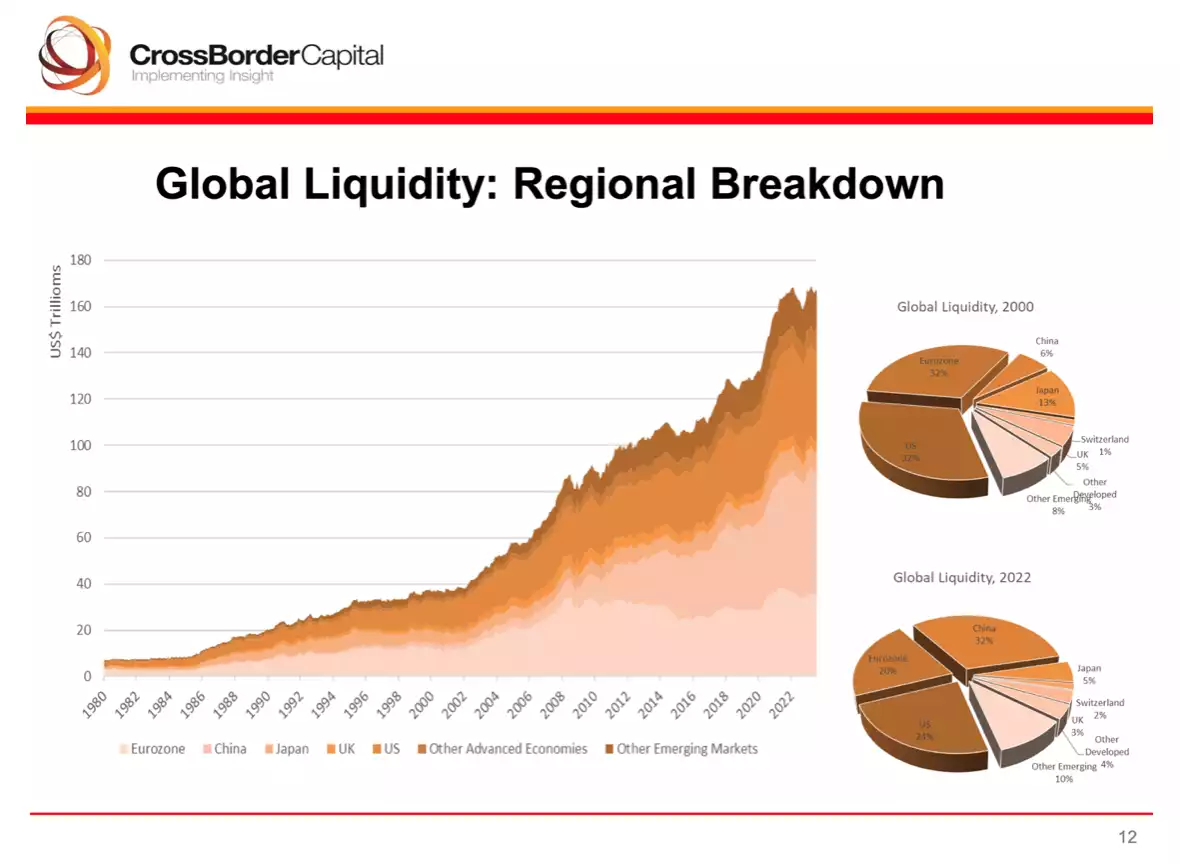
Total Global Liquidity continues on a path upwards over time
Global liquidity, in the most simple terms, can be thought of as how much “money” there is in the system. It can exist and be represented in different ways, which is where it becomes complex, but the big picture view is that the total liquidity continues to head up over time as world governments create more fiat currency in various forms. Governments have no real choice as debt burdens continue to grow and need financing.
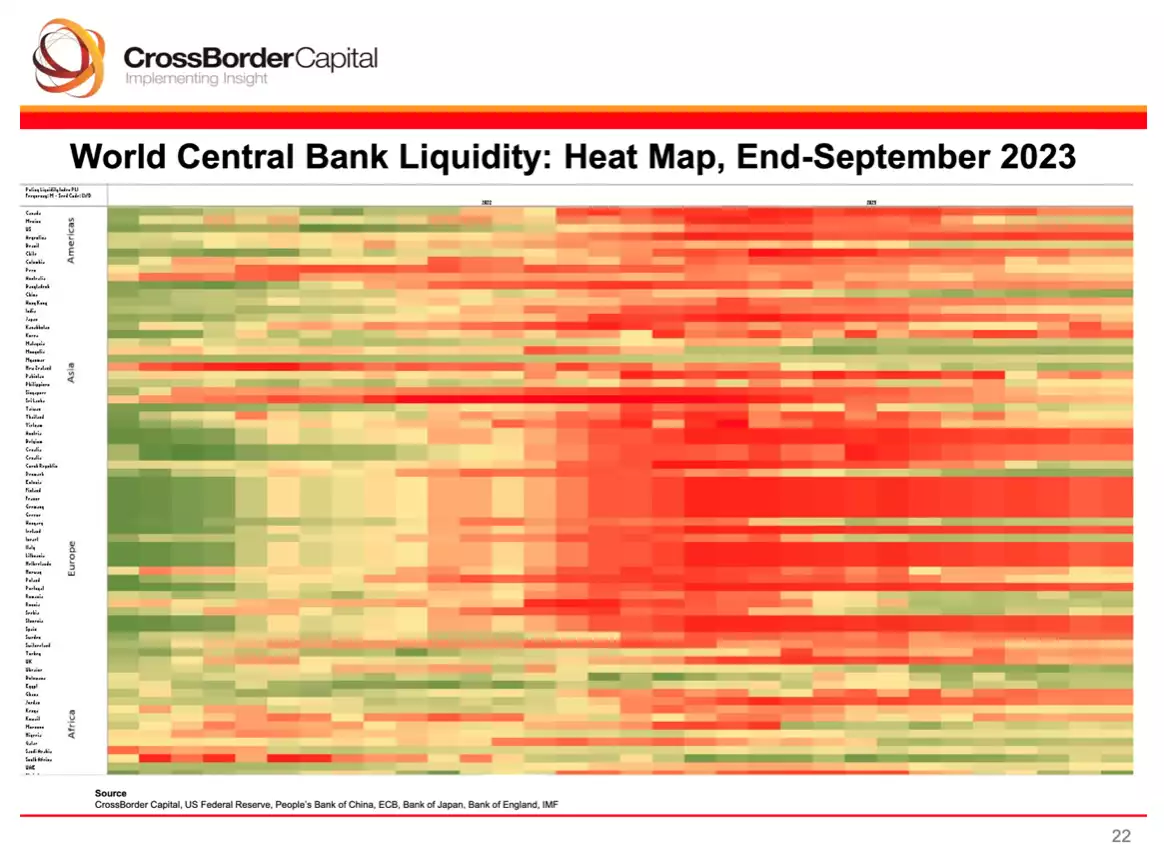
Liquidity follows predictable cycles, and we are heading into a new cycle of more Global Liquidity flooding into the system
This heat map shows the cycle in motion and what it looks like in reality. The area of green dominance shows the period of rapid expansion, while the area of red dominance shows the period of rapid contraction. We are coming out of a period of rapid contraction and starting to enter a new “green” period of liquidity expansion.
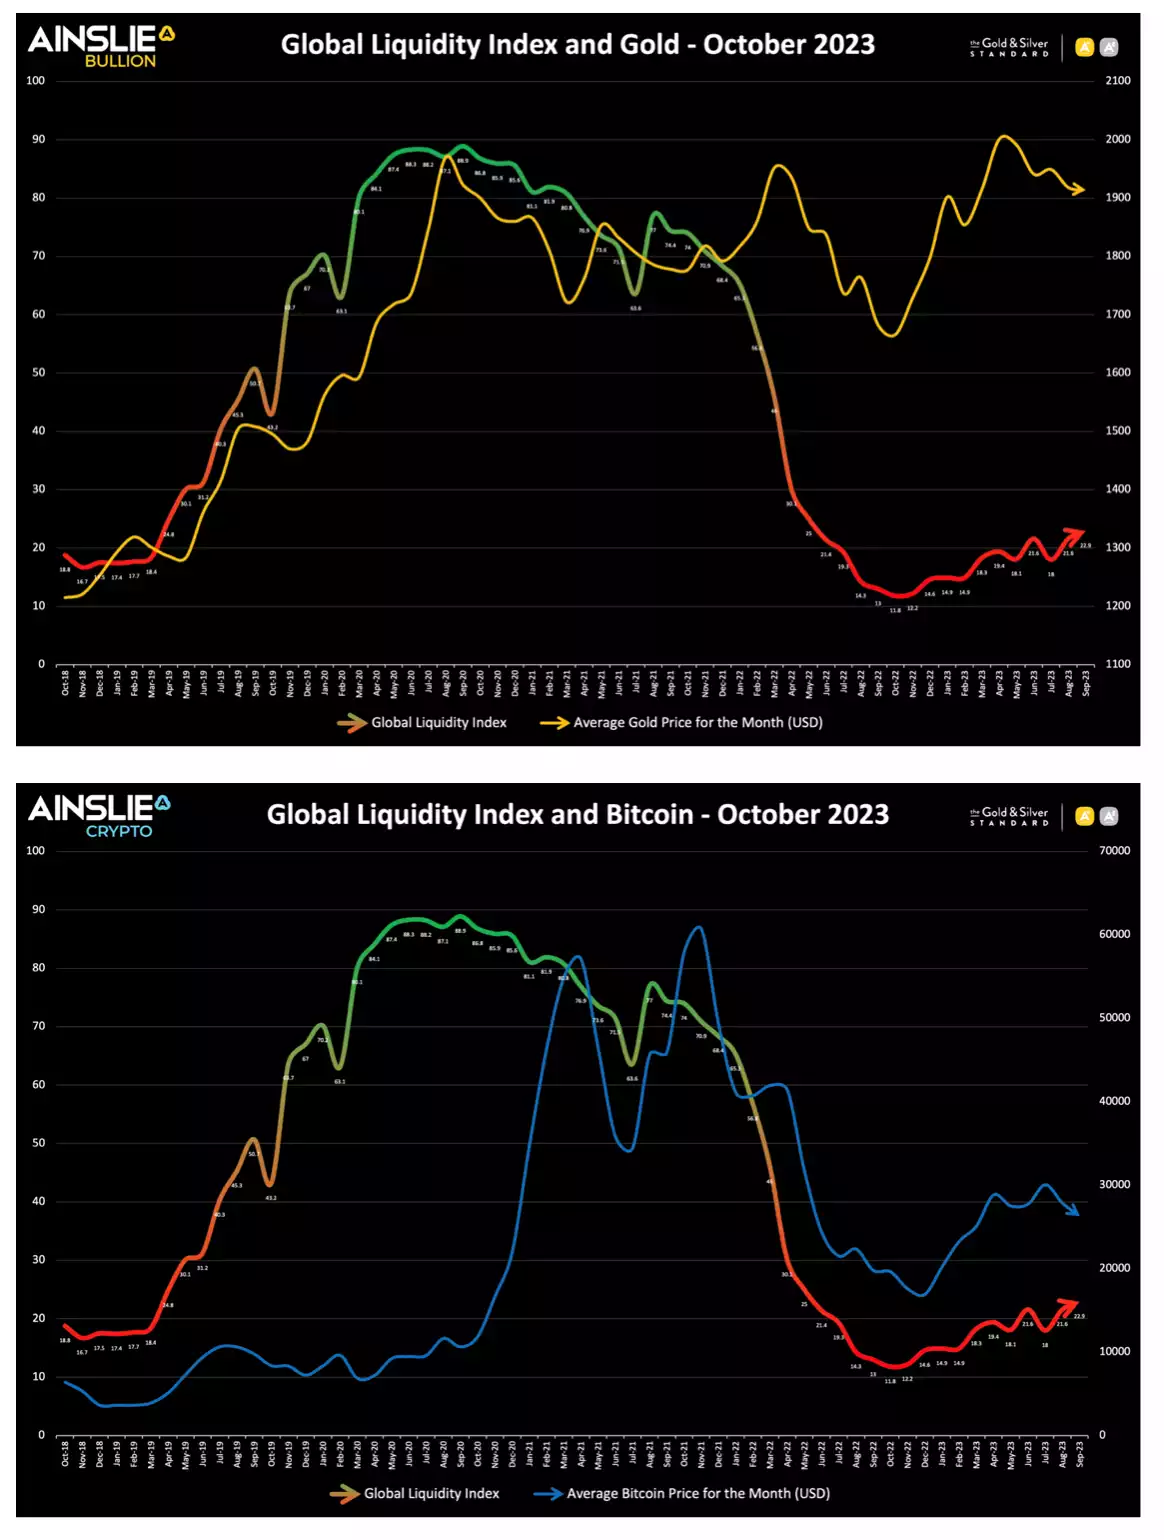
Gold and Bitcoin are the best assets to trade against the Global Liquidity Cycle
Some assets are better than others at more accurately reflecting the Global Liquidity Cycle. Even though most assets go up over time in dollar terms as more total liquidity is added to the system, Gold and Bitcoin act as Monetary Inflation Hedges, which means they are among the best assets to specifically select to trade to take optimal advantage of the cycle.
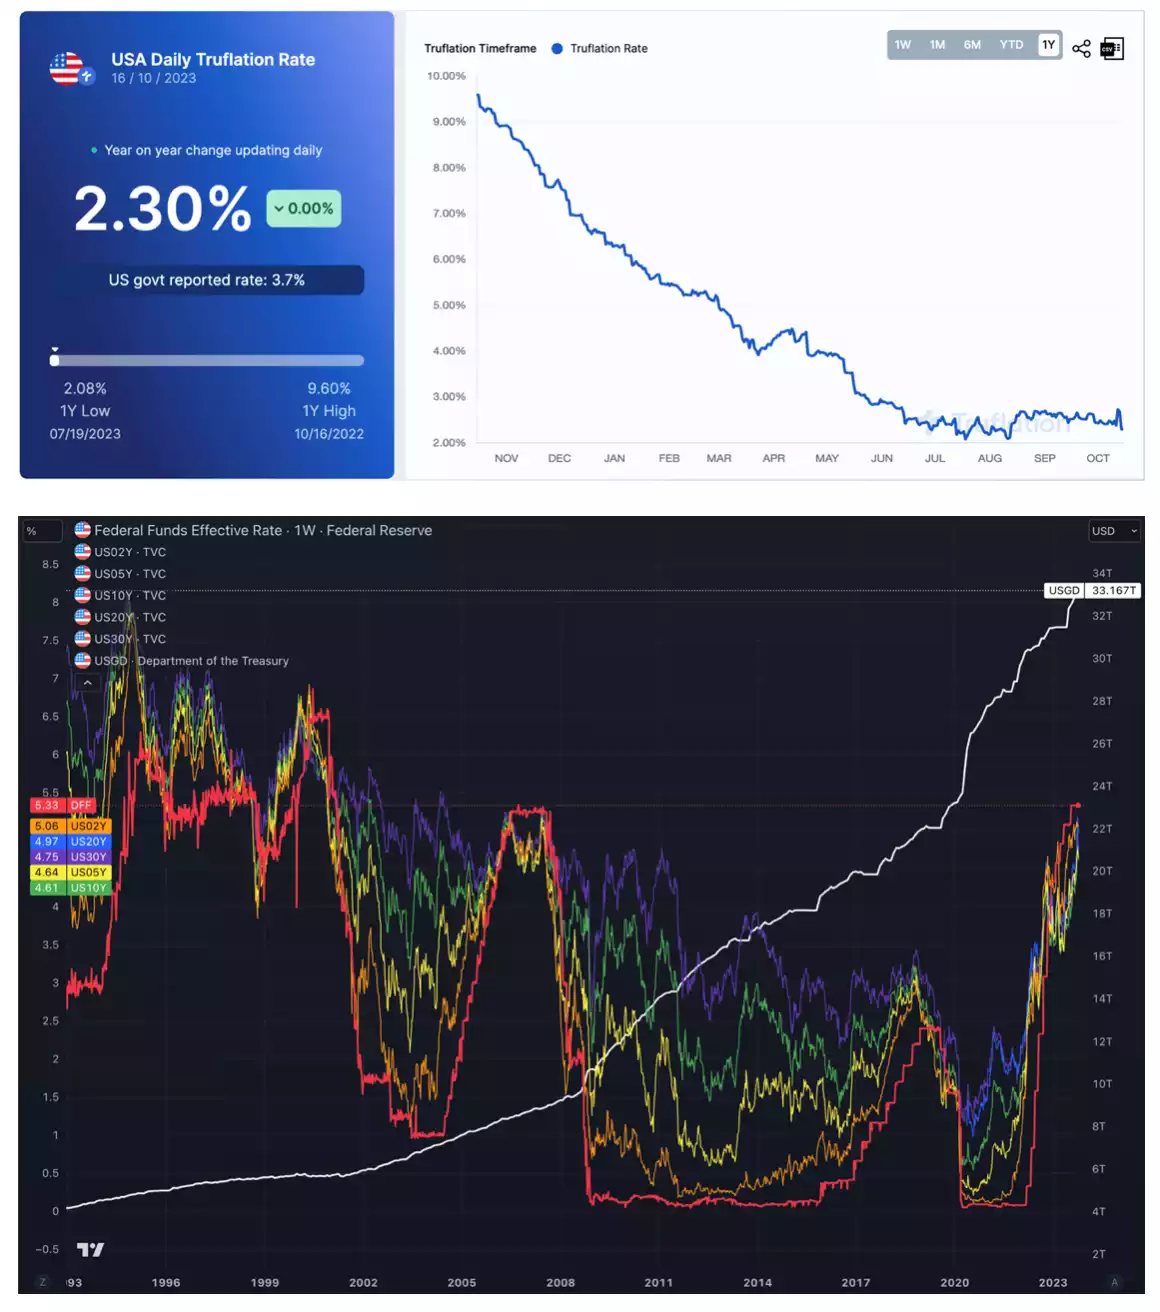
It is important to understand the difference between Consumer Price Inflation and Asset Price Inflation as well as how the Bond market is behaving to add further context to what is likely to happen next
Watch the full presentation with detailed explanations on our YouTube Channel here: https://www.youtube.com/watch?v=Gn8vdDxyXjo
We love feedback, so feel free to leave any questions or comments in the YouTube channel for us to follow up on – especially about whether you find this kind of presentation useful to continue producing in the future!