World Gold Council Gold Demand Trends – Full Year and Q4 2023
News
|
Posted 06/02/2024
|
8403
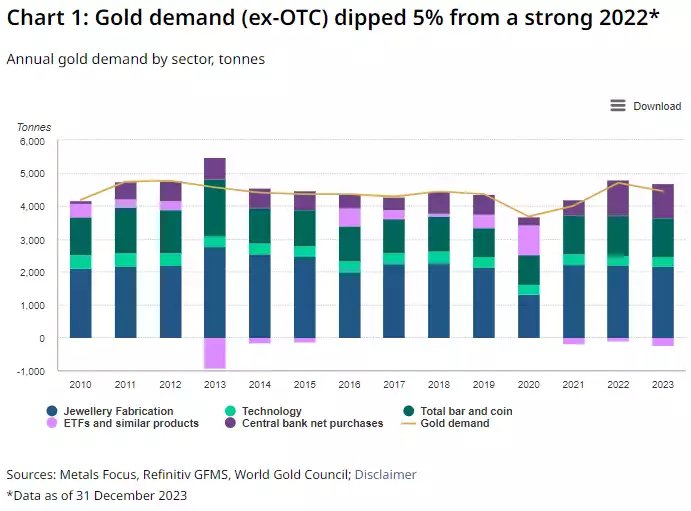
The WGC have just released their quarterly Gold Demand Trends which includes the 2023 full year wrap up. In short it was a record year of demand with an incredible 4,899 tonne of the precious metal taken up and that number despite the 3rd consecutive annual outflows from ETF’s. Again, central banks were the headline act maintaining a “breakneck pace” of buying. 2023 also saw a record high year end price. As usual we present a summary of who was buying and look at supply too. Importantly we layer this against the liquidity backdrop with amazing results (spoiler alert.. 2024 looks good!)
Looking at the gold price first, the year broke 2 records; the highest year end close at $2078/oz (up 15% for the year) and also the highest average price of $1940/oz, 8% higher than the 2022 average.
The WGC normally quote with and without OTC (over the counter) numbers as OTC (which includes sales through Ainslie for instance) are harder for them to get solid numbers on and hence omitted from official figures.
Investment
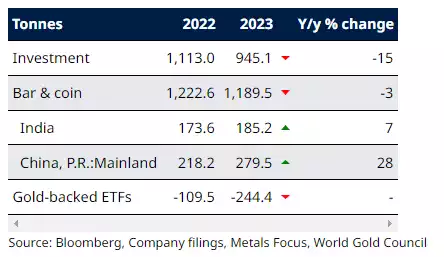
ETF outflows, together with a modest decline in bar and coin demand, saw total annual gold investment sink to a 10-year low of 945t. Again, per above this excludes OTC numbers which add around 450 tonne when included.
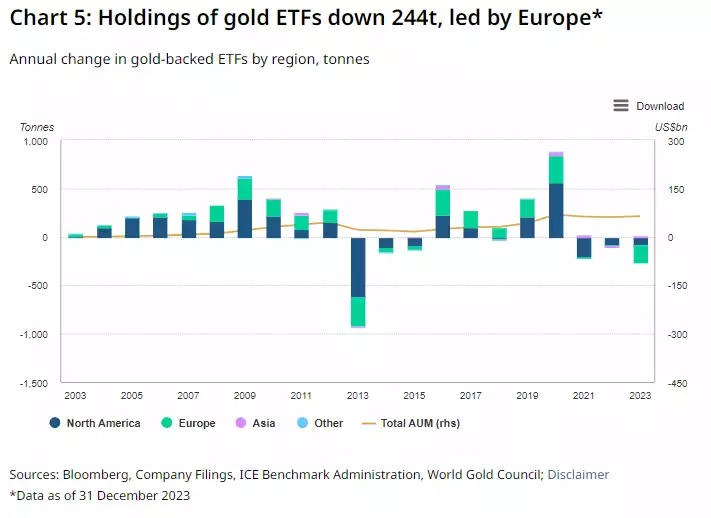
- Global gold ETFs registered a third consecutive year of net negative tonnage demand; global holdings dropped by 244t (-US$15bn)
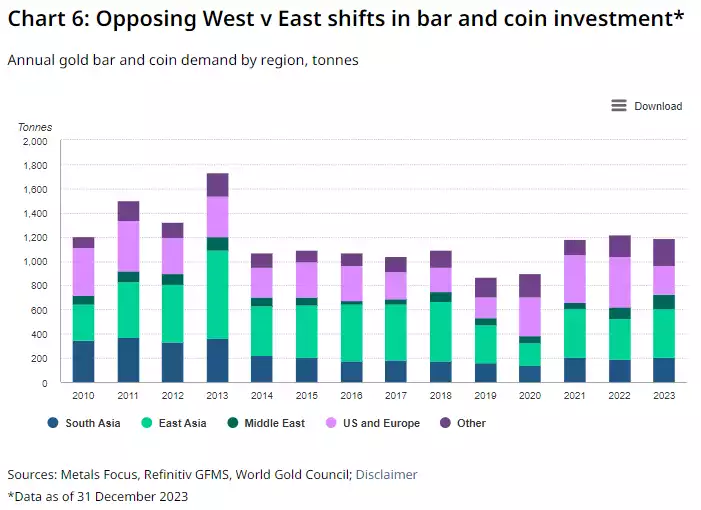
- Annual bar and coin investment totalled 1,190t, down by a modest 3% y/y, in part reflecting base effects of a very strong H2’22
- A steep drop in European gold investment in 2023 was, to a large degree, countered by strength in China.
The investment piece should not be a surprise to regular readers, particularly those who keep abreast of our monthly Global Liquidity updates. Last year represented the turning of this cycle which few understand. ETF investors will have been buying in to the ‘high rates are bad for gold’ thesis and hence the sheeple outflows in a year that saw outward facing monetary tightening signals. As readers of our Global Liquidity updates know, that was only a part of the global picture which actually saw liquidity coming back into the global economy and hence gold up 15% in a year the old thesis would say it goes down. 2024 looks set to be the year that pace picks up demonstrably off the bottom and highly constructive for higher gold and silver prices so closely correlated with it. If you want evidence of that just look at the ETF flow chart below and compare it to the Global Liquidity Index – 5-6 year cycles chart in that last update.
When it comes to the real stuff, bars and coin demand, it was again consistent with the liquidity equation as most of the new global liquidity came from Asia and surprise, surprise… Asia dominated demand.
Central Banks
Central bank gold reserves swell by more than 1,000t for the second successive year.
- Central bank demand totalled 229t in Q4, 35% lower q/q
- This lifted full year central bank net purchases to 1,037t, just 4% below 2022’s record haul
- Reported gross buying and selling were both higher in 2023. The People’s Bank of China and the National Bank of Poland added the most, while the Central Bank of Uzbekistan and the National Bank of Kazakhstan were the biggest sellers.
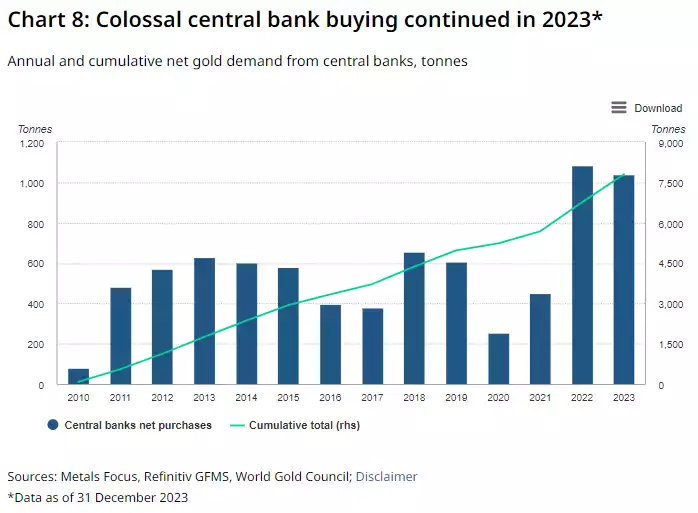
From a macro sense, if there is one chart to look at it is the above. The old saying ‘don’t do as they say, do as they do’ is so important. Many would argue that the debt based fiat money ponzi scheme we are seemingly at the tail end of was largely orchestrated by the world’s central banks. That they themselves are ploughing into gold should be a signal for all to heed and action.
Jewellery
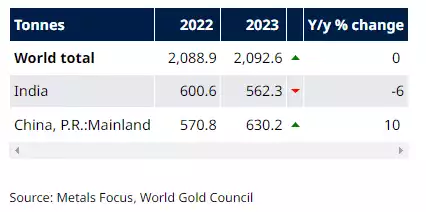
In a year of record high gold prices (in the U.S. dollar as well as many other currencies), global gold jewellery demand managed to secure marginal gains – from 2,089t to 2,093t. In value terms, this translates to 8% growth and a record US$131bn.
- Global annual gold jewellery consumption was little changed in 2023; in fact, it was fractionally higher y/y even though the gold price set new records.
- China was the main engine of growth as demand recovered from a relatively weak 2022, but there were other pockets of growth – most notably in Turkey
- Demand in India was impacted by gold price strength, generating a notable tonnage decline y/y.
Technology
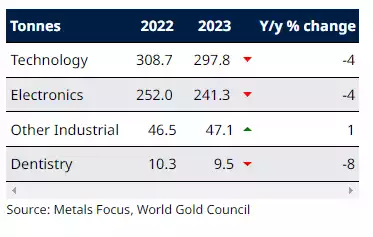
A promising recovery in Q4 saw demand reach a seven-quarter high of 81t; but 2023 was a weak year for the sector and annual demand fell below 300t for the first time.
- Gold demand in the technology sector rose by 12% y/y to 81t during Q4, driven by a recovery in electronics (+14% y/y to 66t)
- Full-year demand was down 4% to 298t – the lowest annual total in our data series
- Consumer electronics demand has suffered throughout the year but there is optimism that the late recovery will continue into 2024.
Supply
Total gold supply in 2023 increased 3% y/y as mine supply and recycling both posted growth.
- Annual mine production increased 1% y/y although remained just below 2018’s record high
- The global hedge book increased slightly during 2023 to 190t
- Full-year recycled gold supply rose 9% but remains approximately 30% below the all-time high seen in 2009, despite 2023’s record annual average gold price.
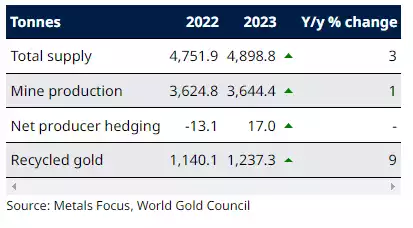
Mine production posted another gain in 2023, up 1% to 3,644t, although this total fell just short of the 3,656t record set in 2018. After a strong first half we had expected 2023 to mark a new high for the global gold mining industry, but the growth rates seen in the first two quarters were not replicated in the second half of the year. Mine production in Q4’23 fell 2% y/y to 931t, resulting in a weaker H2 than expected. This, together with some minor downward revisions to H1’23, left global mine production a fraction lower than in 2018.
Higher annual output was seen from South Africa (+14t or 15% y/y), where production recovered following protracted industrial action in 2022; Russia (+6t or 2% y/y); Mali (+5t or +4% y/y,); Brazil (+4t or 4% y/y) and Burkina Faso (+3t or 3% y/y).
Lower yearly production was seen in Sudan (-8t or -10% y/y), where domestic conflict disrupted artisanal production; Indonesia (-8t or -6% y/y); Mexico (-7t or -6% y/y) and Australia (-7t or -2% y/y).
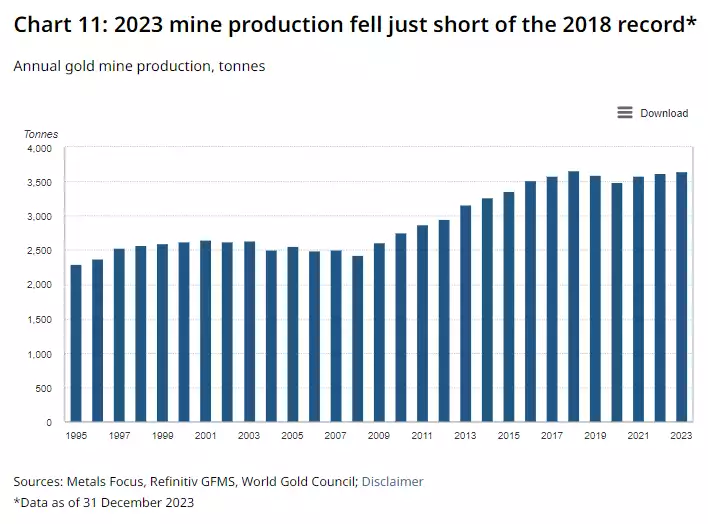
Again, one must look at the above chart in stark contrast to that of global liquidity, with that being a proxy for the amount of freshly created ‘money’ in the system. Herein lies gold’s enduring value. In a near record year, gold’s supply increased by just 1%. Compare that to the amount of USD the U.S. Fed alone has created in just 16 years… around 883% more verses around 20% for gold….
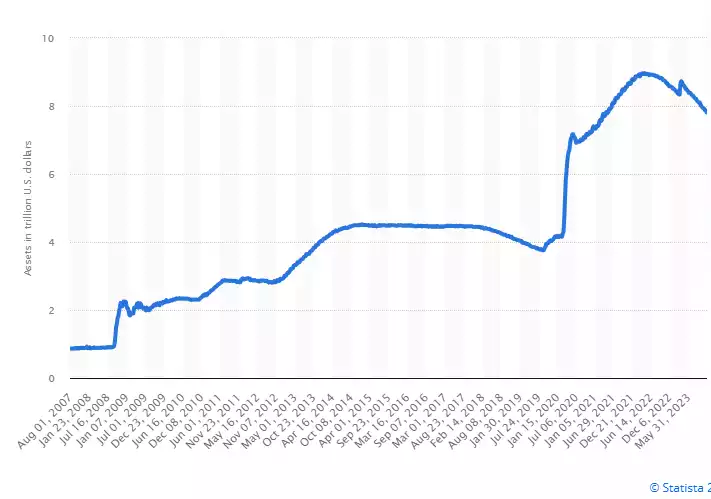
As we mentioned before, that downward trend in the chart above over 2022 and 2023 has weighed on gold and yet it is still near all time highs in price. 2024 almost certainly will be a year of a reversal of that trend and more importantly the U.S. is only one part of a liquidity cycle that is already fully heading up right now. Those that know (and indeed that caused it… central banks) are buying and keeping that price higher despite the blind ETF’s selling. That will not last. The liquidity is coming and gold LOVES it.