Global Liquidity, Gold and Bitcoin: January 2024 Update
News
|
Posted 25/01/2024
|
9494
Today we bring you the latest Monthly Update on Global Liquidity and its impact on Gold and Bitcoin released by our Chief Economist, Chris Tipper. As usual, this is a worthwhile read, and we encourage you to take some time over your long weekend break to watch the attached video version (follow the YouTube link provided at the end or click here) to stay up to date on where we are in the cycle, as a primary driver of Gold and Bitcoin prices for the year ahead. We highlight a few of the key charts today for anyone looking to understand specifically how Global Liquidity is driving the Gold and Bitcoin price, combined with actionable trade ideas to take advantage of the opportunity currently presented.
As we start 2024 with a lot of uncertainty in the world, one thing has remained crystal clear. Global Liquidity continues its march higher! Global liquidity levels have stabilised at US$169.7tr, comfortably above the US$166.6tr weekly average recorded in 2023 and also above the peak US$168.7tr when the Fed stepped into support financial markets at the time of the SVB crisis as you can see in the chart below.
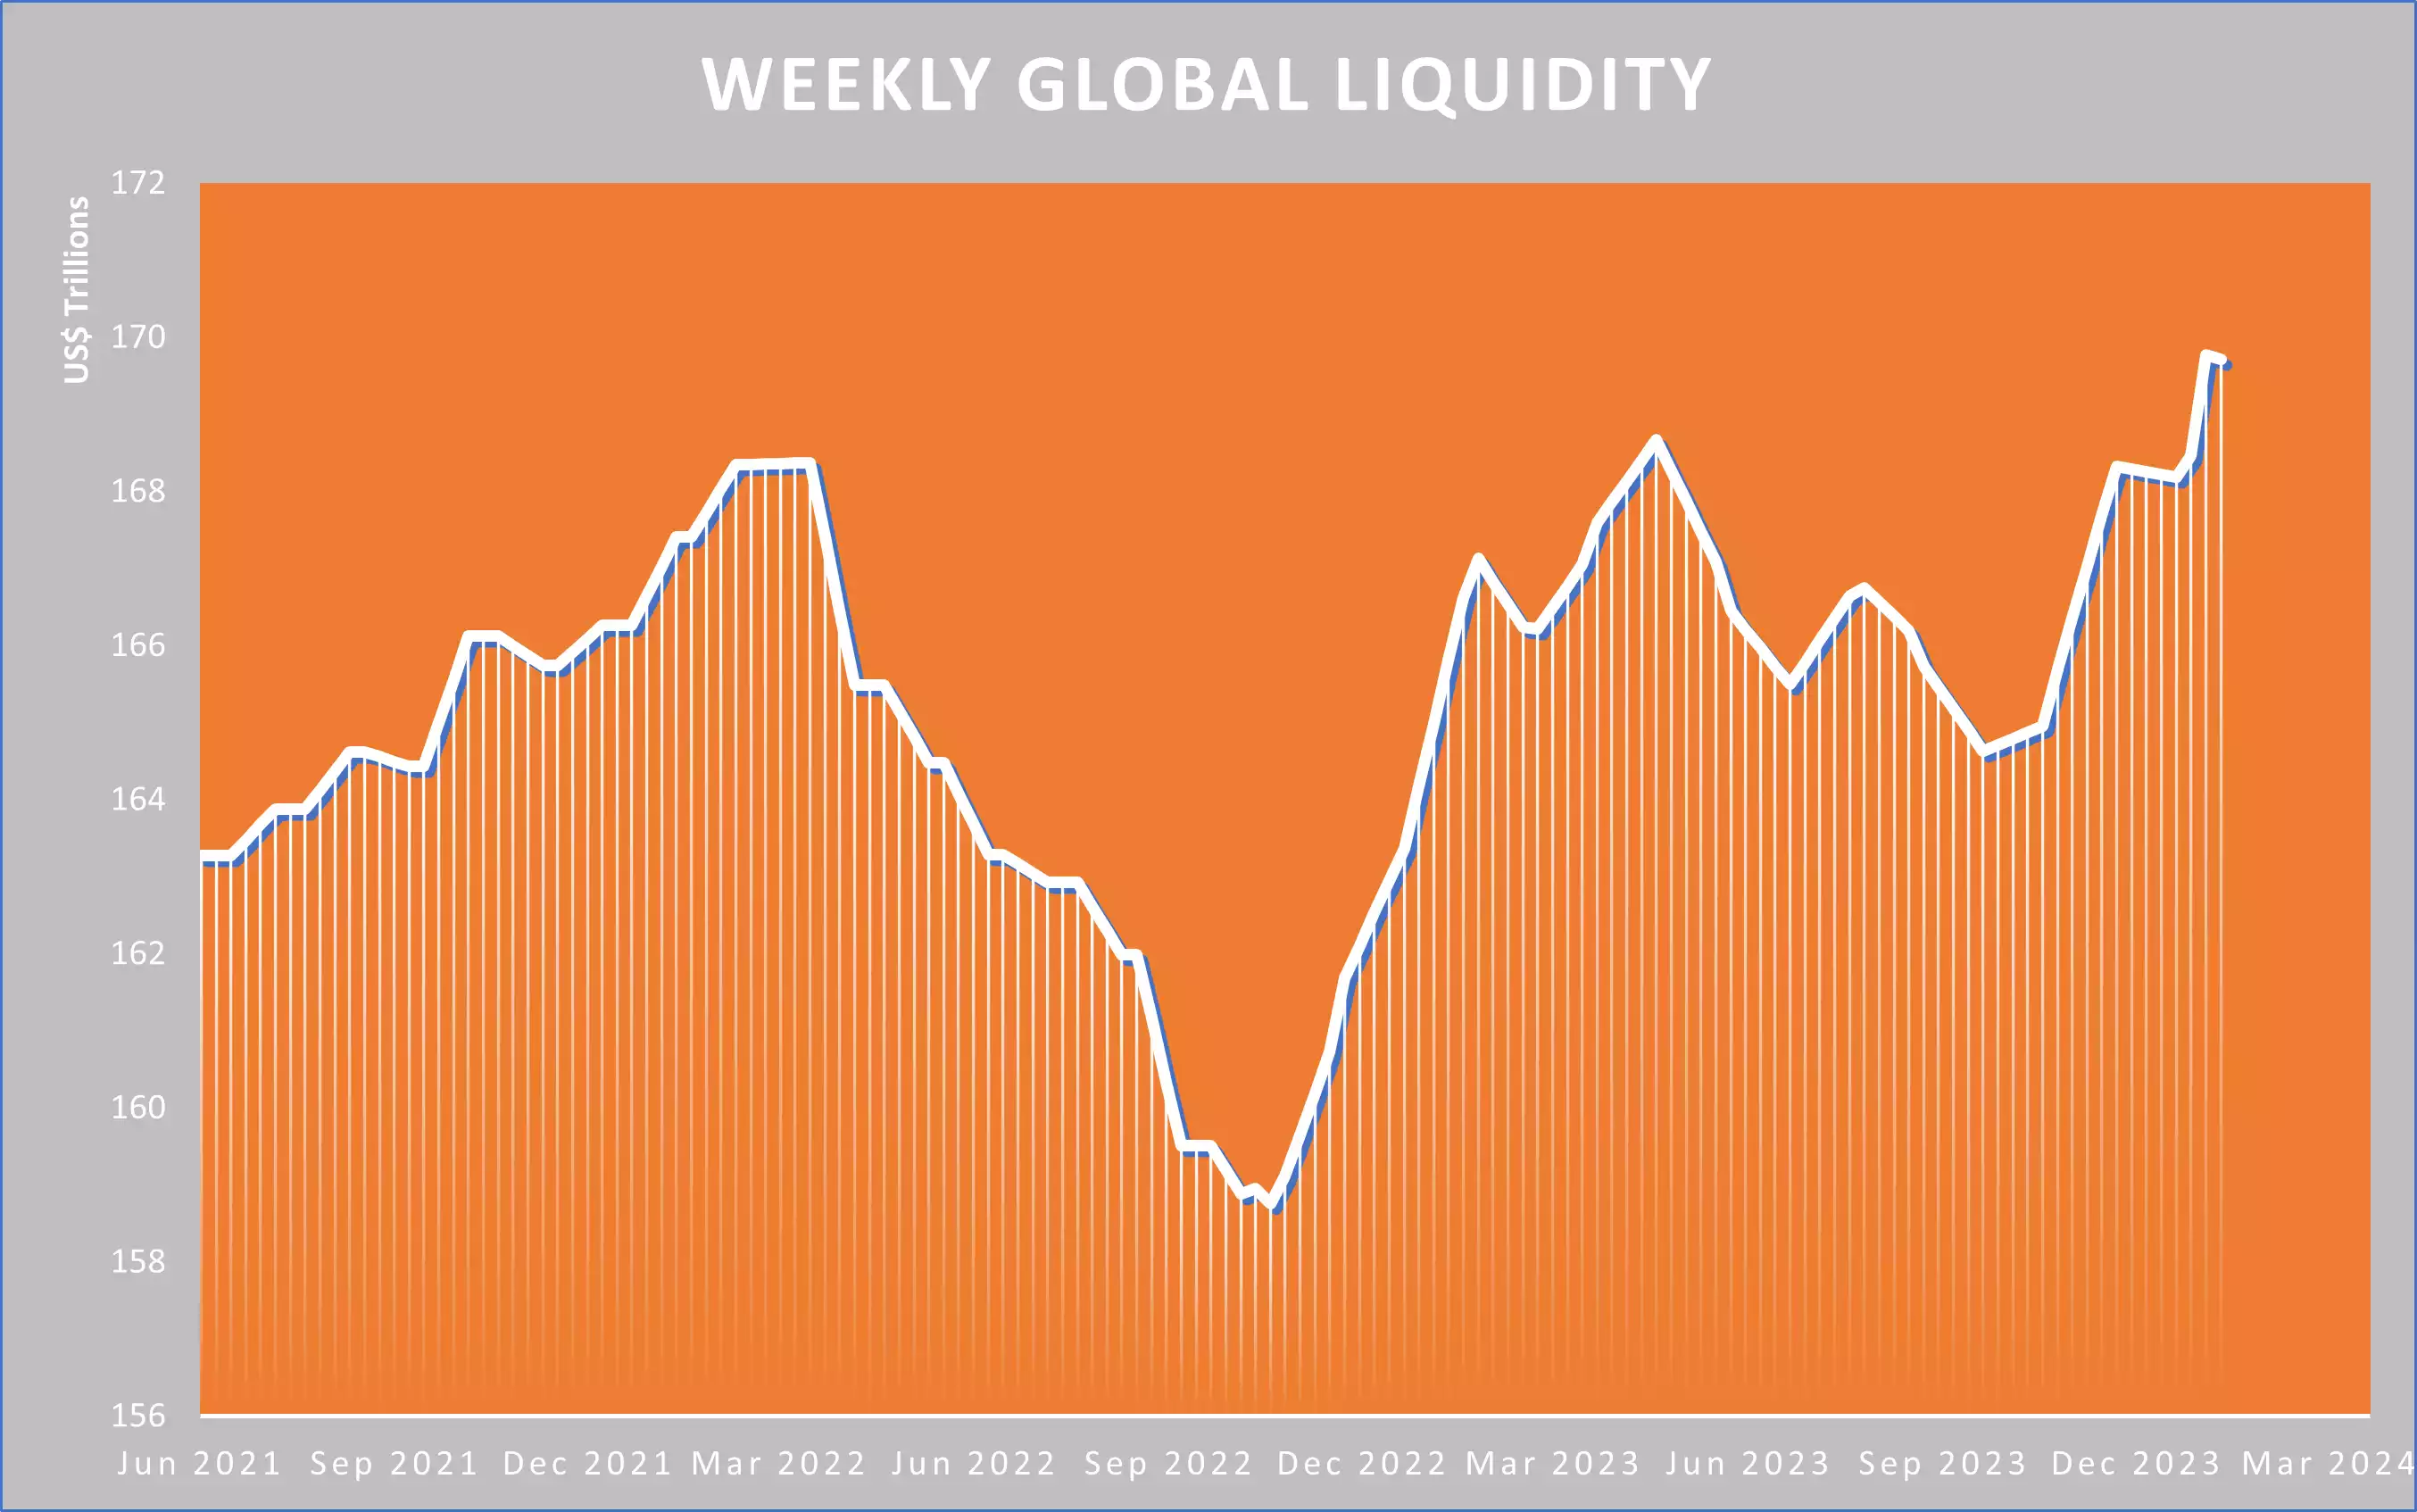
We mentioned last month that in many ways 2023 was a year that caught many who don’t understand the Global Liquidity Cycle off guard as we didn’t get the broad “market crash” people expected. We have been arguing that this is largely because the Global Liquidity Cycle bottomed in October 2022 and that investors faced a relatively benign “rebound” investment regime that is likely to continue until a peak in late-2025. As always, things never move in a straight line, but we now expect to have the wind behind us for the year ahead and not in front.
The exciting thing for us, as people who believe strongly in the potential for Gold and Bitcoin to act as “Monetary Inflation Hedges”, is that we have access to the financial tools necessary to not only protect ourselves, but also take advantage of the cycle as we move further into a world of exploding debt and the corresponding debasement of fiat currency that is underway.
Some Key Highlights:
Global liquidity continues on its long term path “up and to the right”
Global liquidity, in the most simple terms, can be thought of as how much “money” there is in the system. It can exist and be represented in different ways, which is where it becomes complex, but the big picture view is that the total liquidity continues to head up over time as world governments create more fiat currency in various forms. Governments have no real choice as debt burdens continue to grow and need financing.
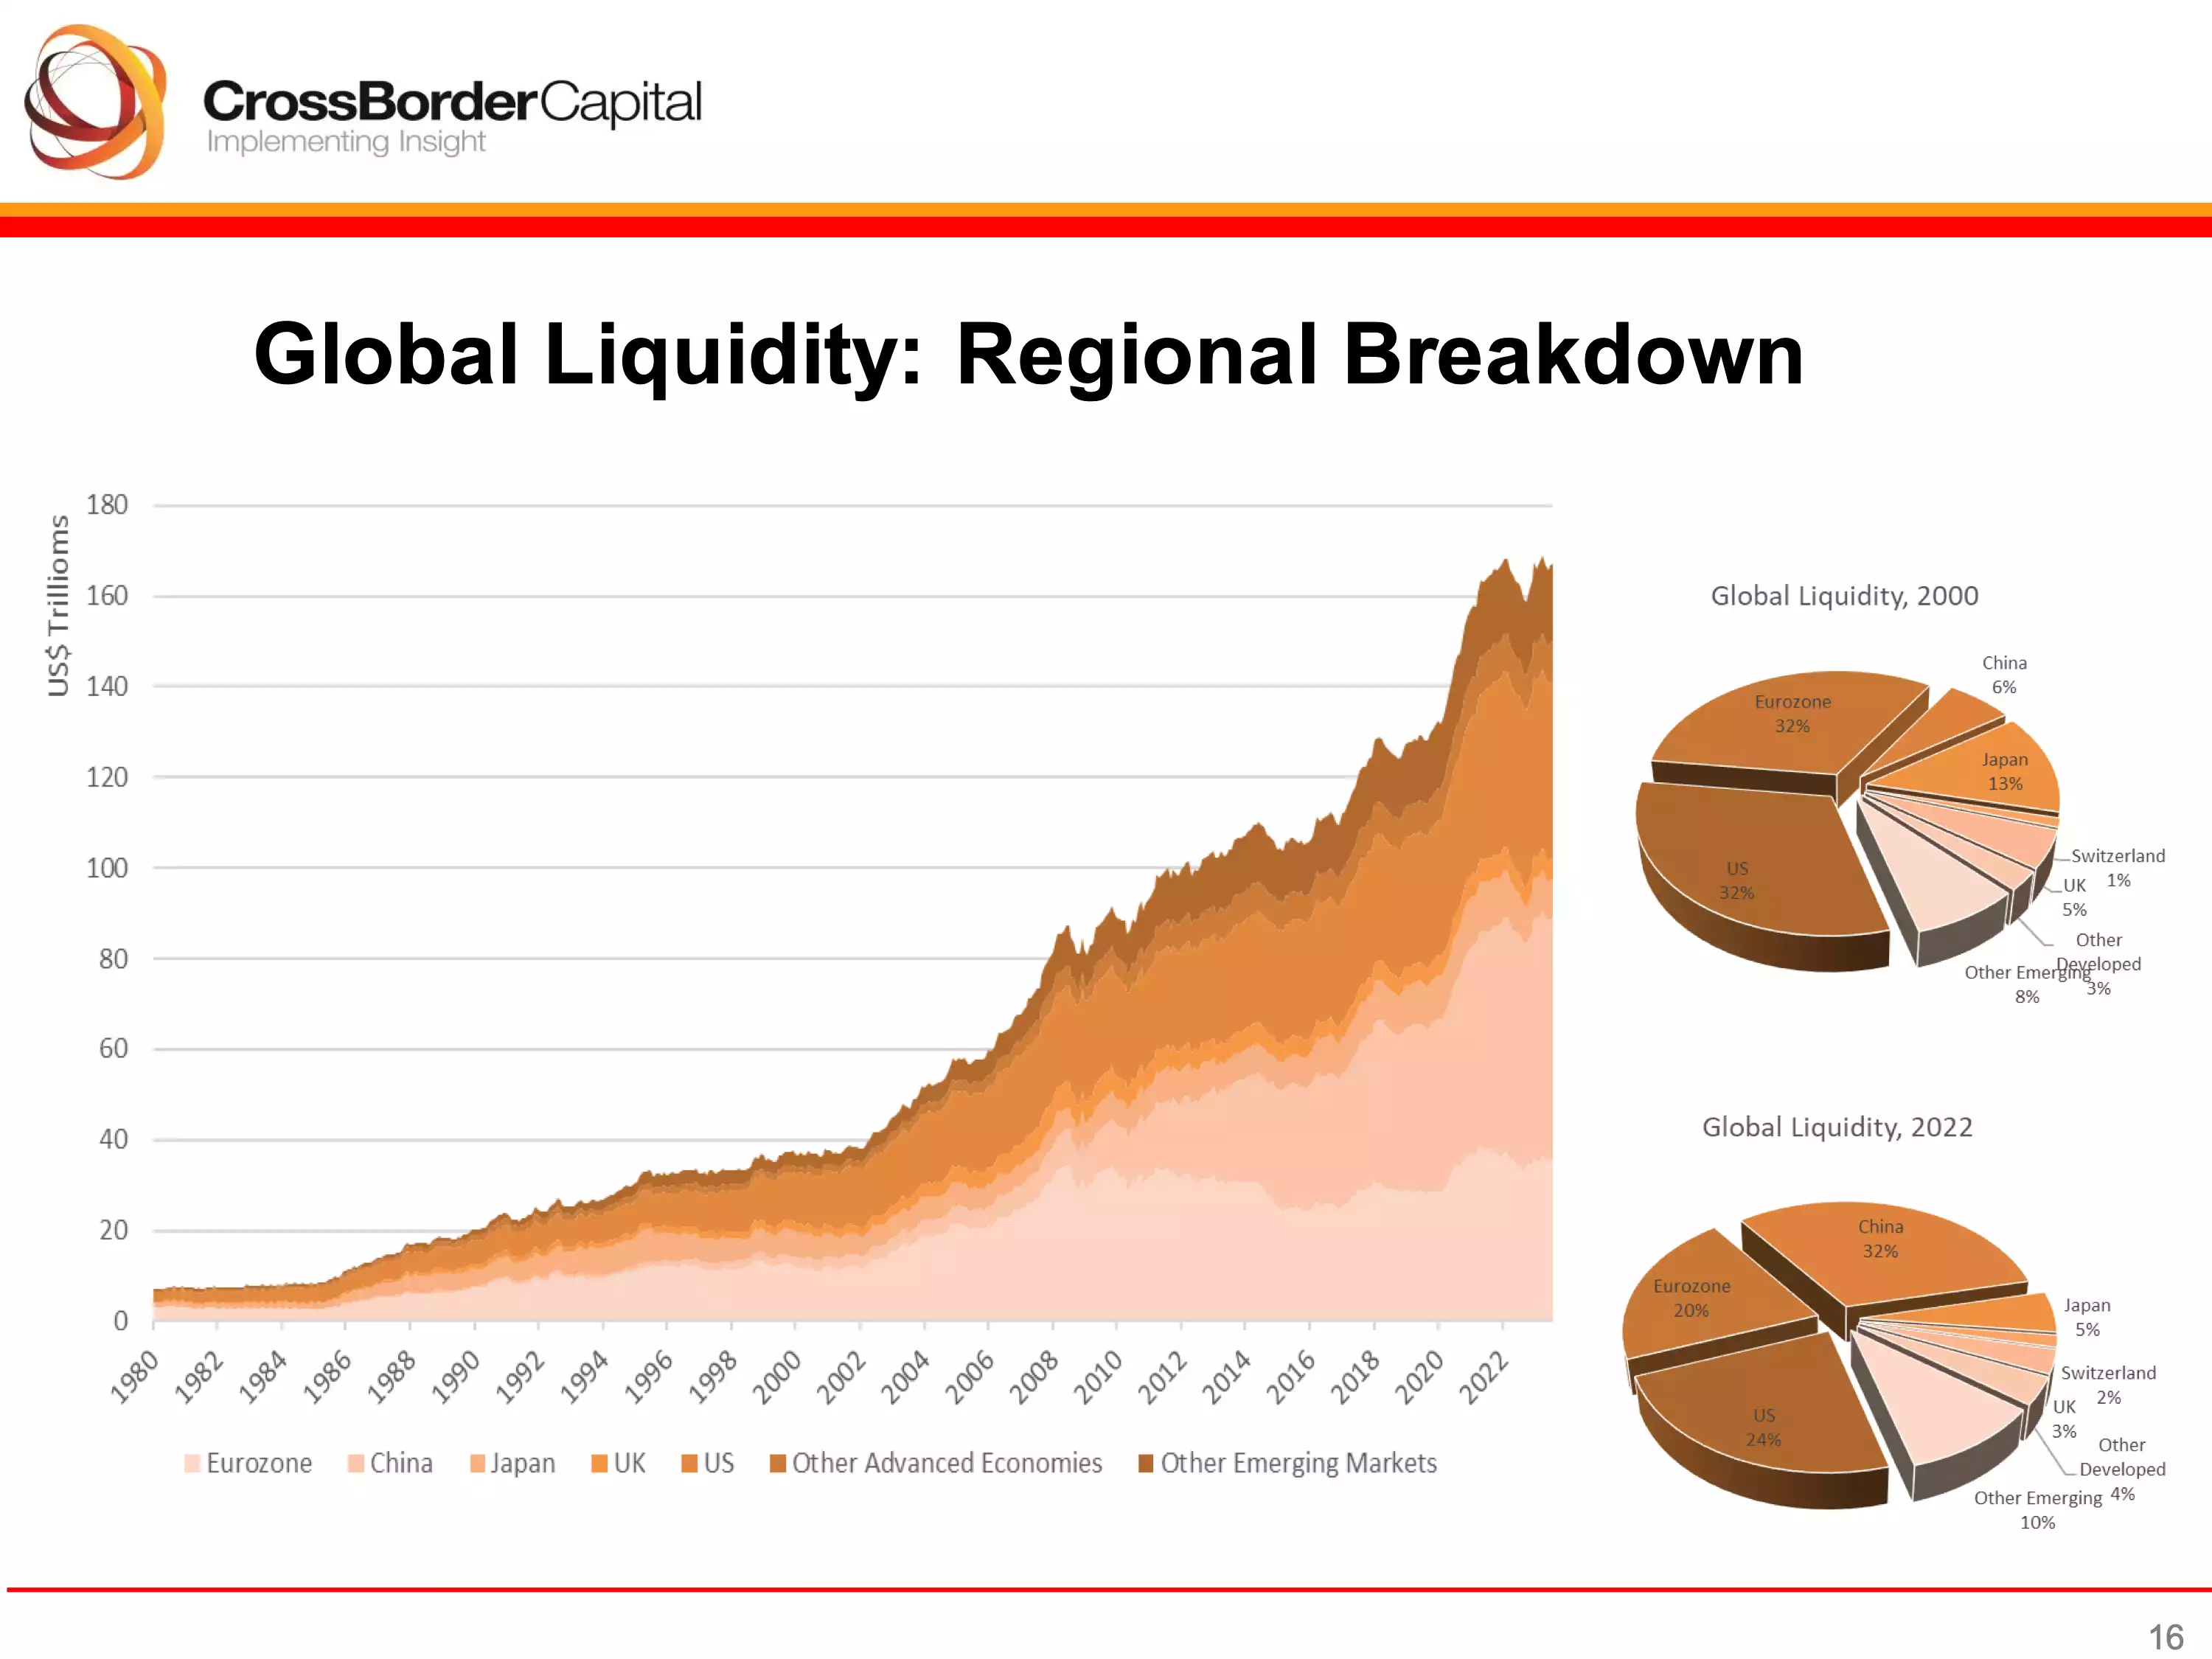
There are predictable and repeated cycles in the way global liquidity increases and decreases
Even though the broader trend for liquidity will always remain increasing over time, there are predictable cycles within the creation of all this new currency that are quite consistent. Governments go through periods of slowing down the production of new liquidity and speeding it up, attempting to smooth out booms and busts in their individual economies.
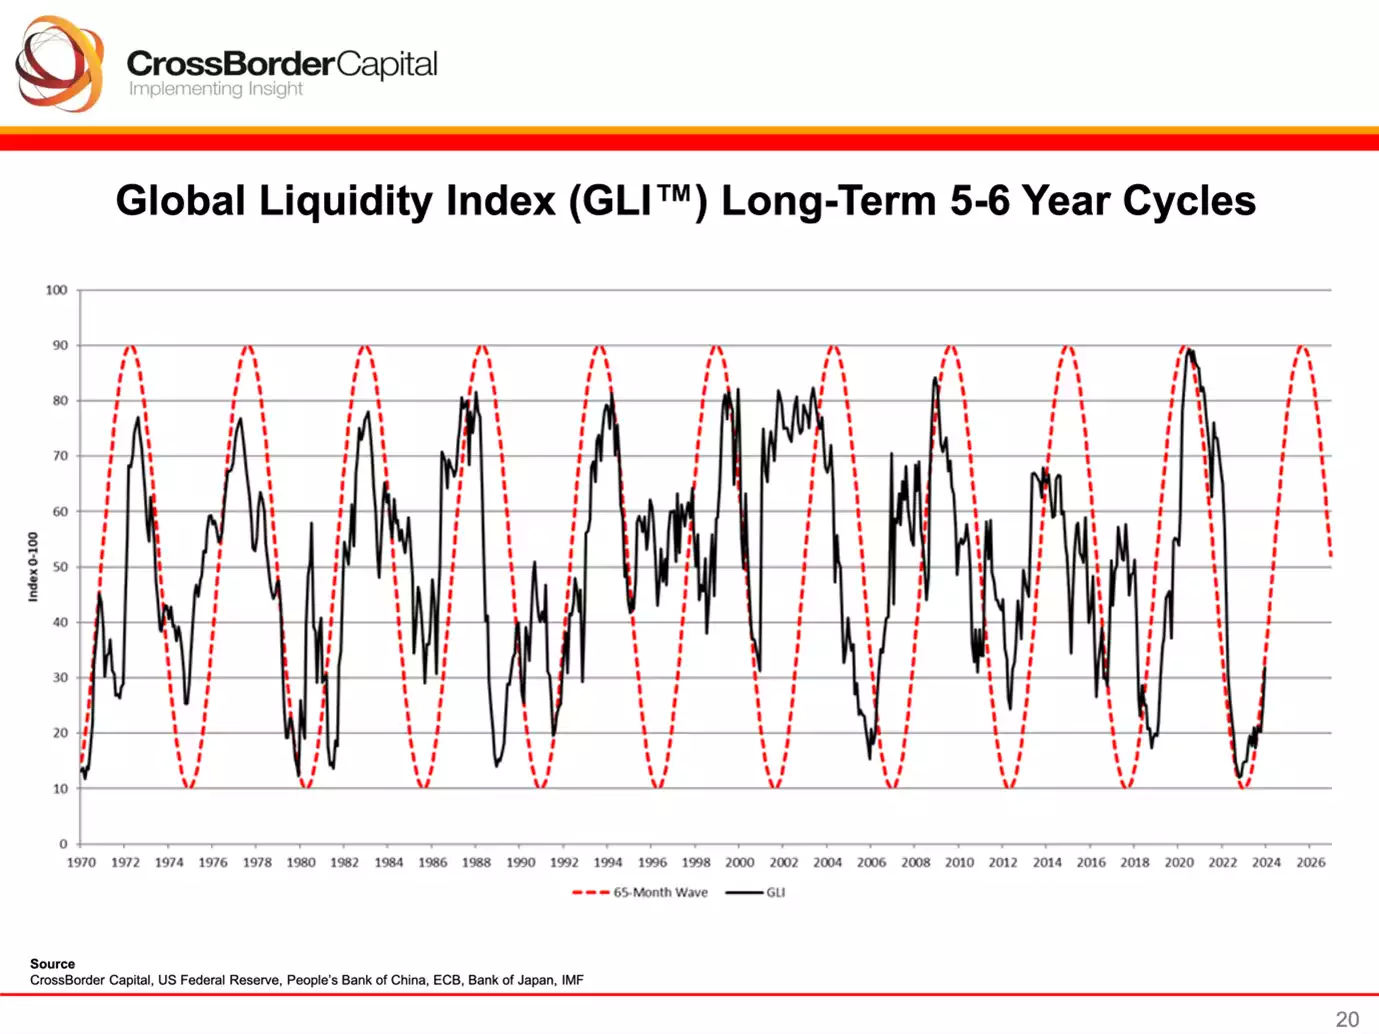
Gold and Bitcoin are the best assets to trade against the Global Liquidity Cycle
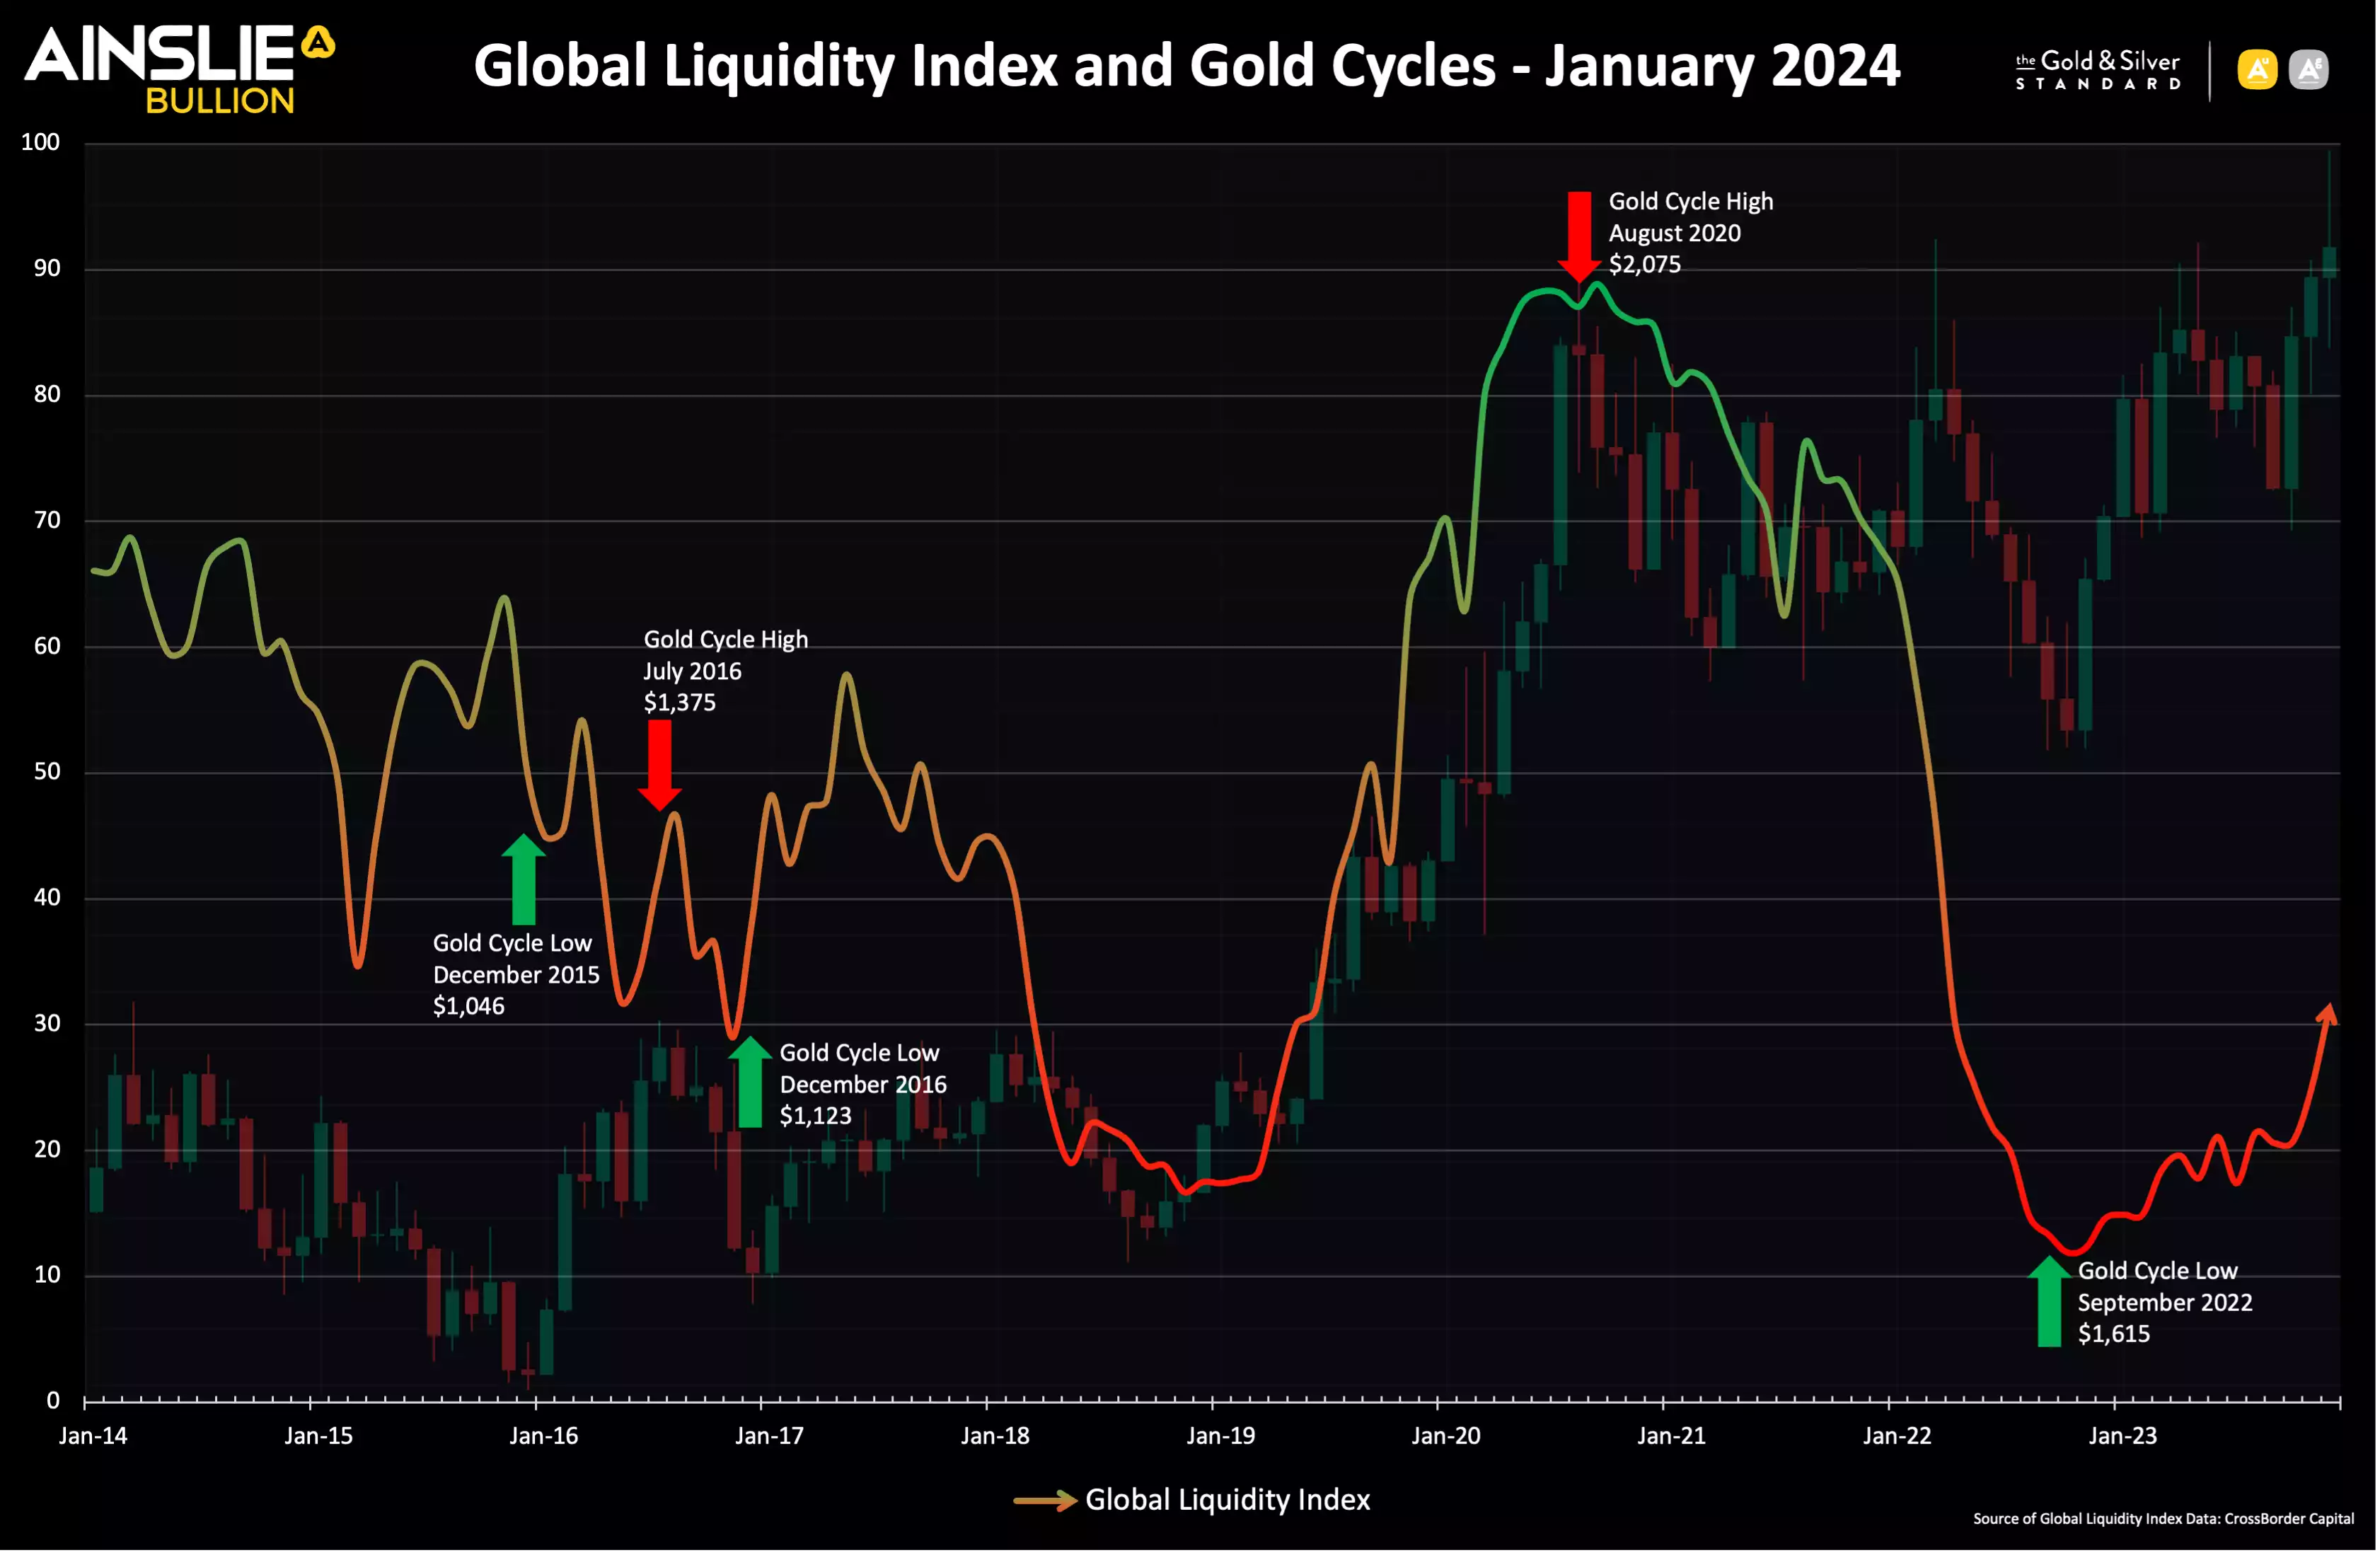
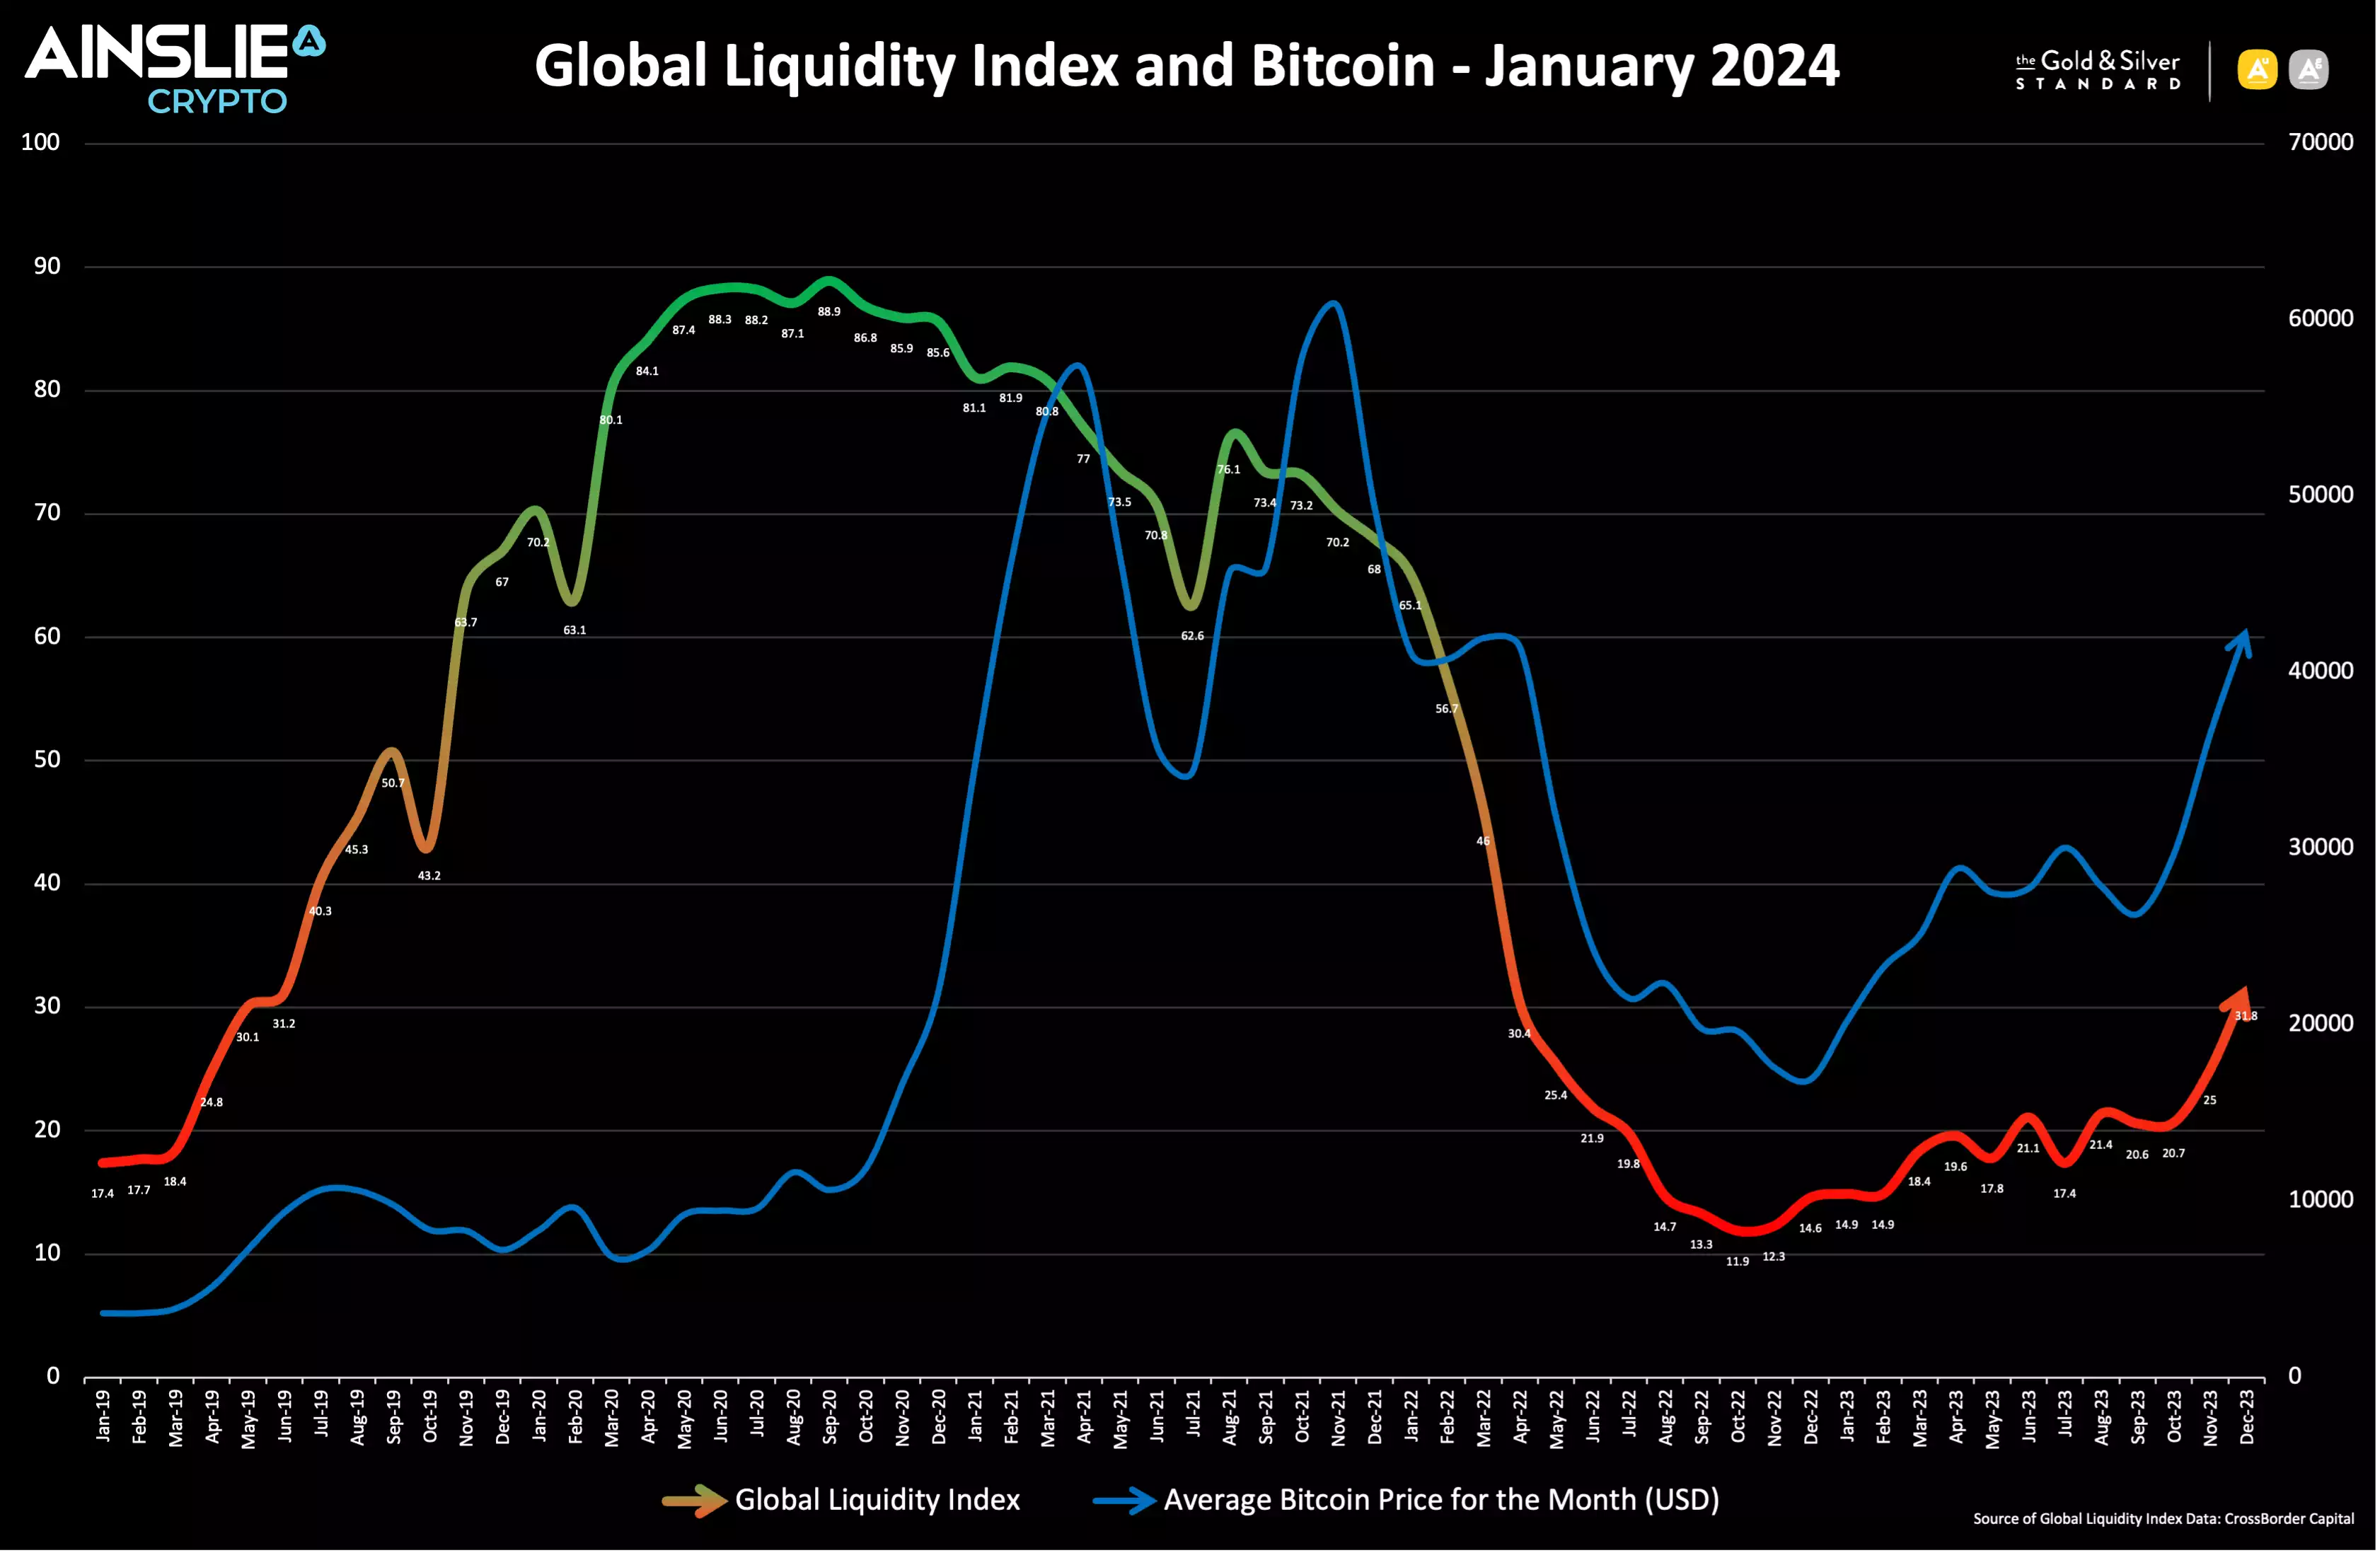
Some assets are better than others at more accurately reflecting the Global Liquidity Cycle. Even though most assets go up over time in dollar terms as more total liquidity is added to the system, Gold and Bitcoin act as Monetary Inflation Hedges, which means they are among the best assets to specifically select to trade to take optimal advantage of the cycle. You can see in these charts the longer-term correlation between the price of Gold and Bitcoin (the candle bars in the background) to the overlayed Global Liquidity Cycle Index line. This correlation is increasing in recent years and the cycle is becoming more pronounced and undeniable as global government debt has started to spiral out of control.
Zooming in…
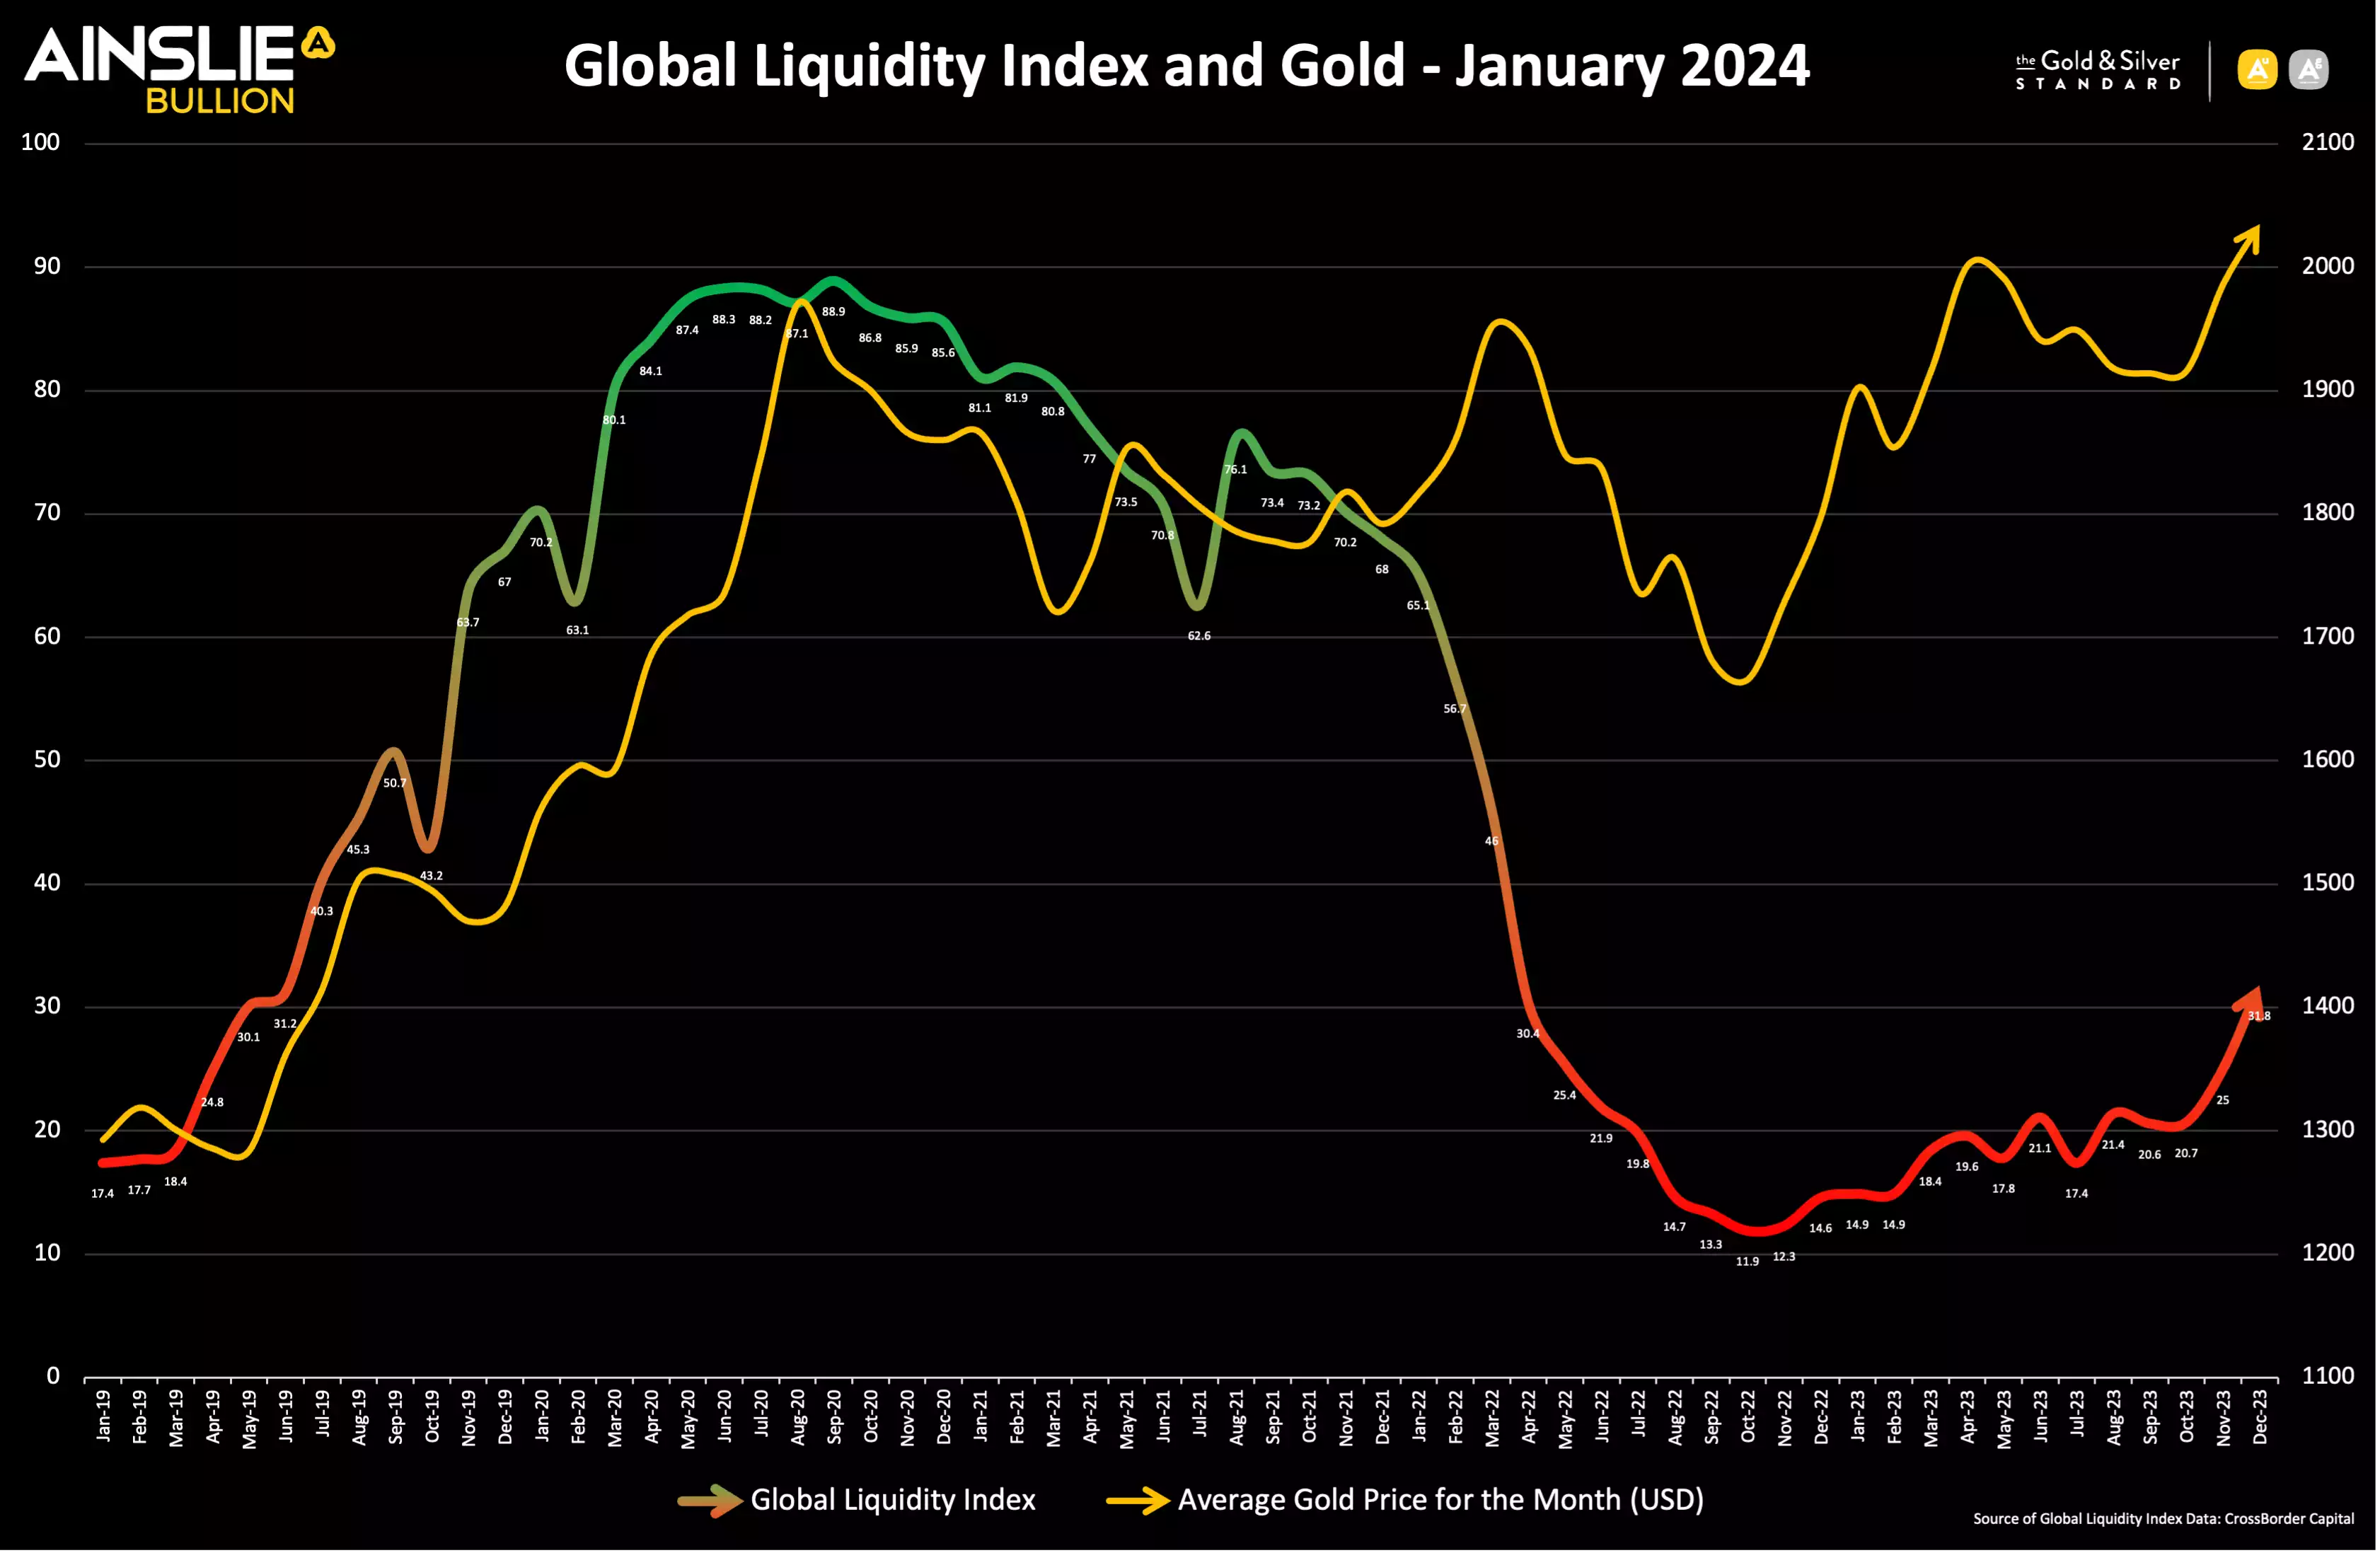
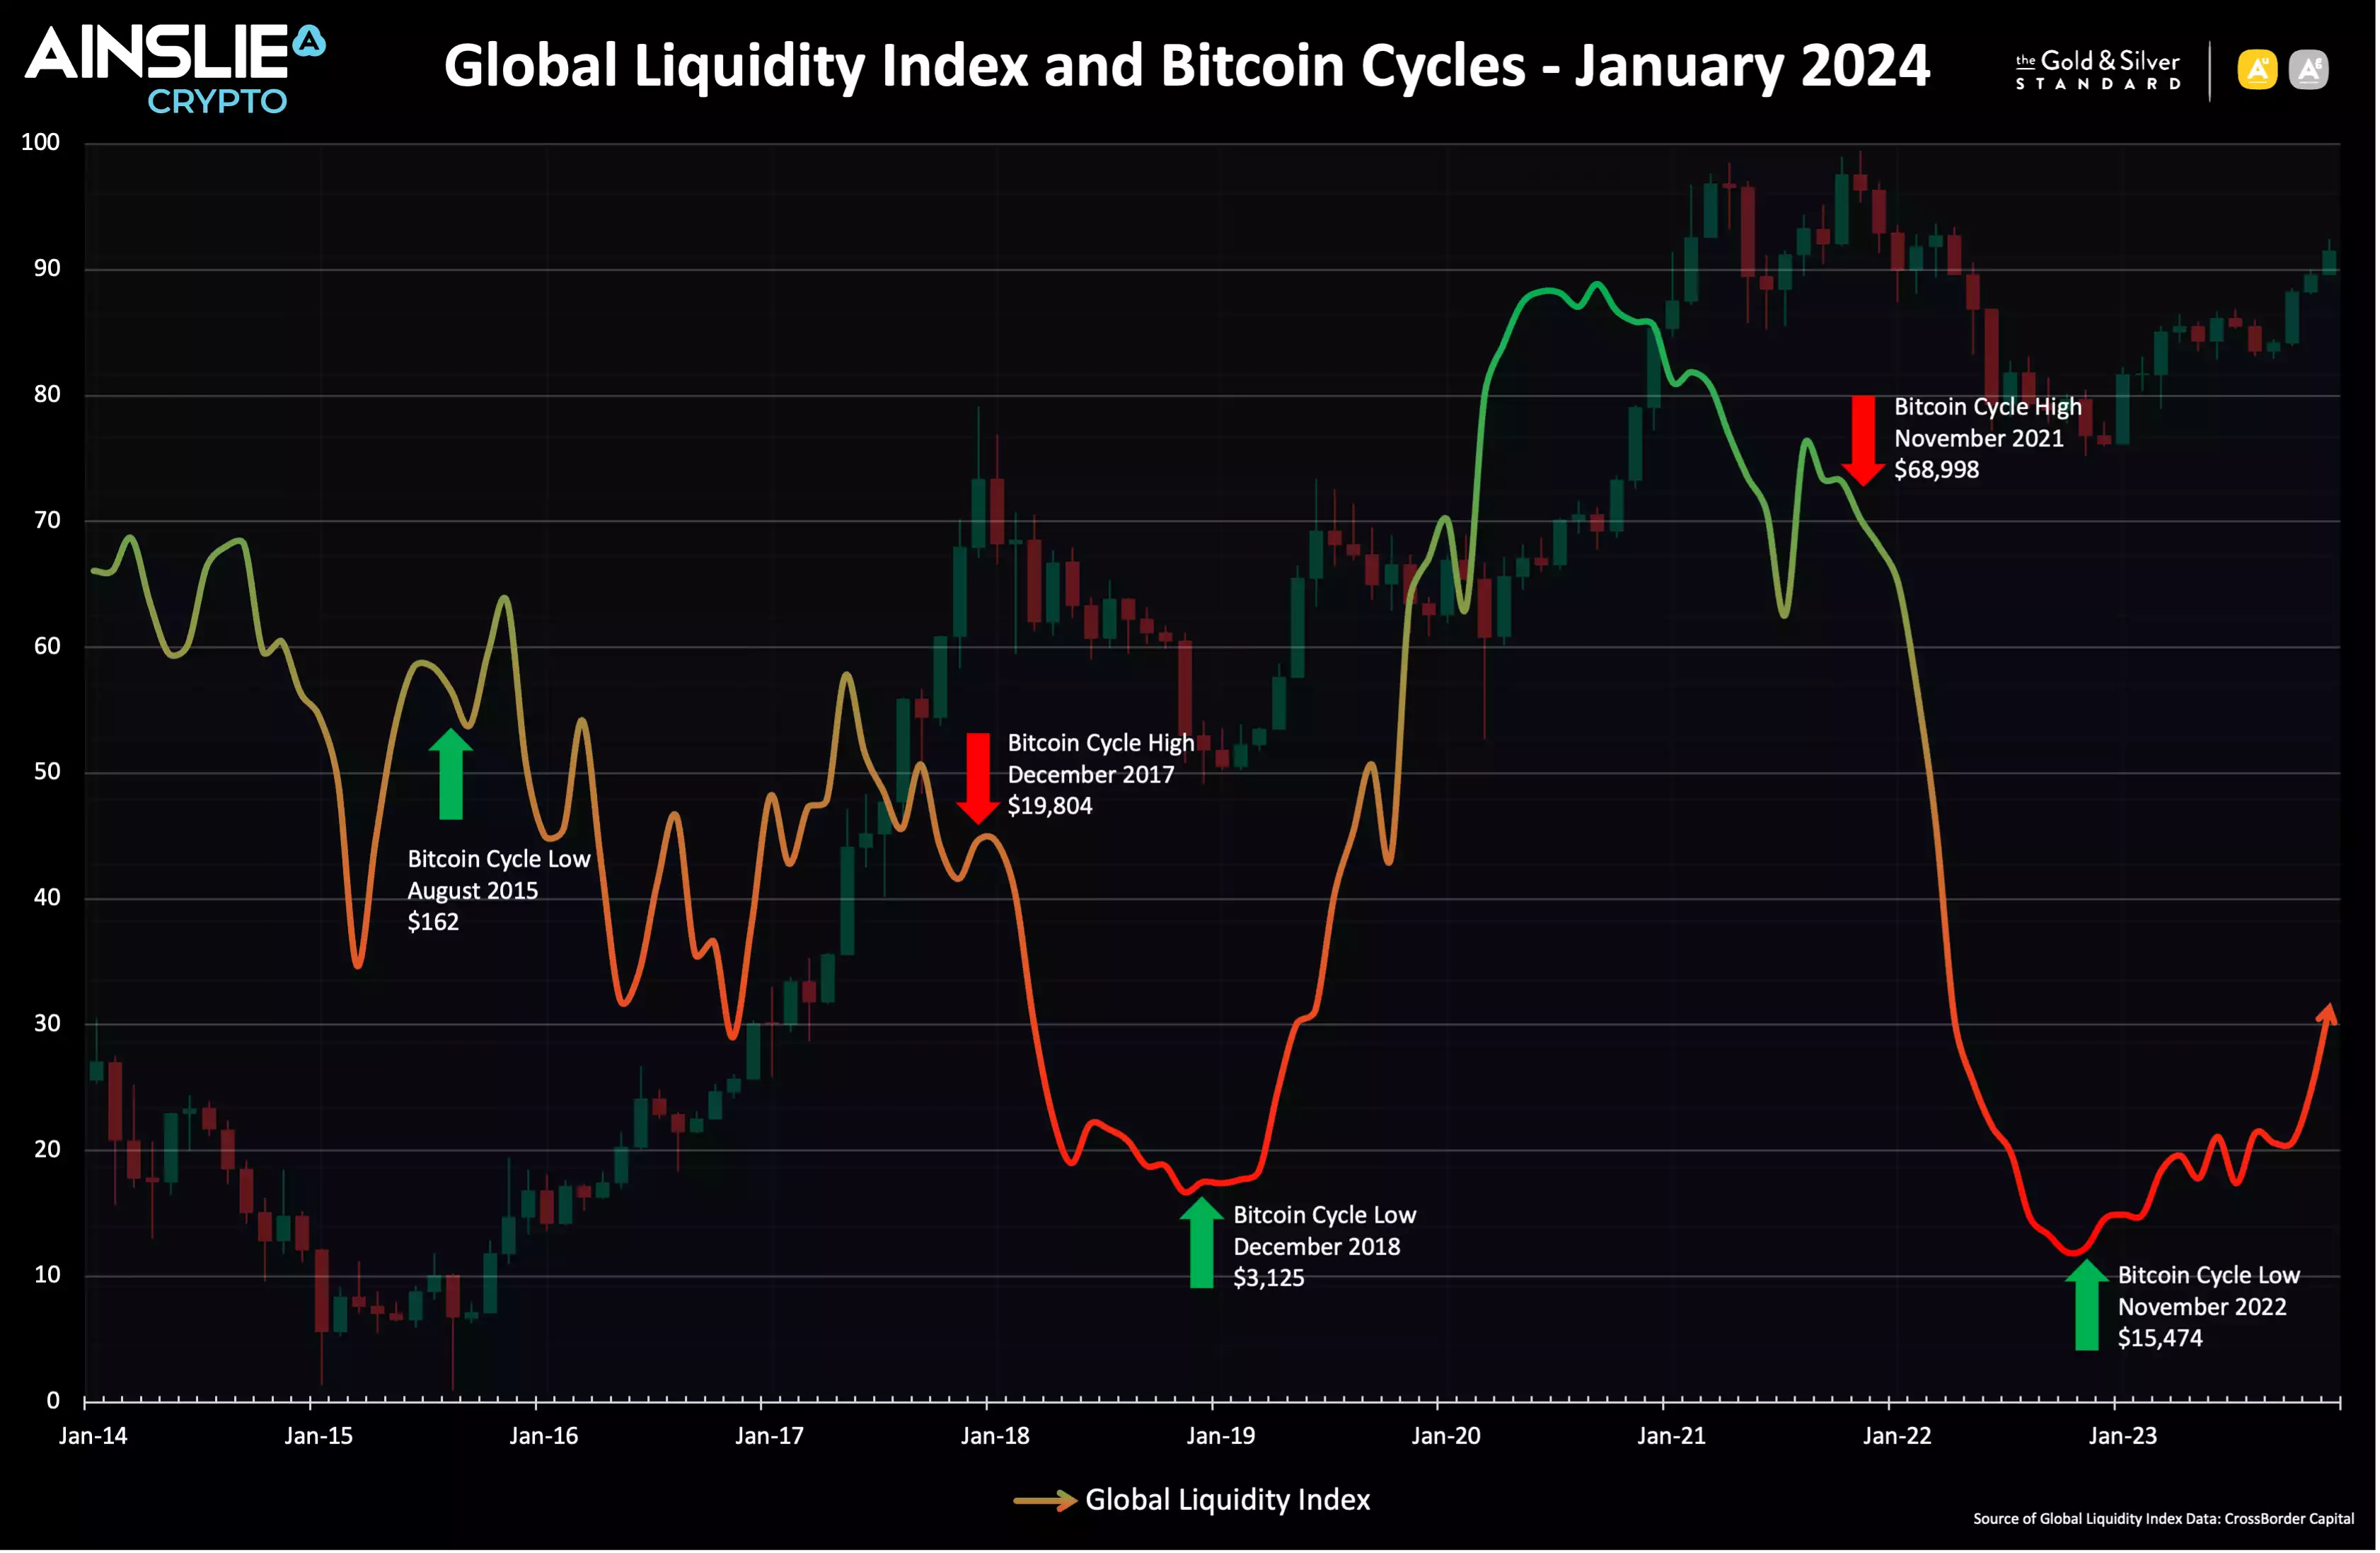
Zooming in…
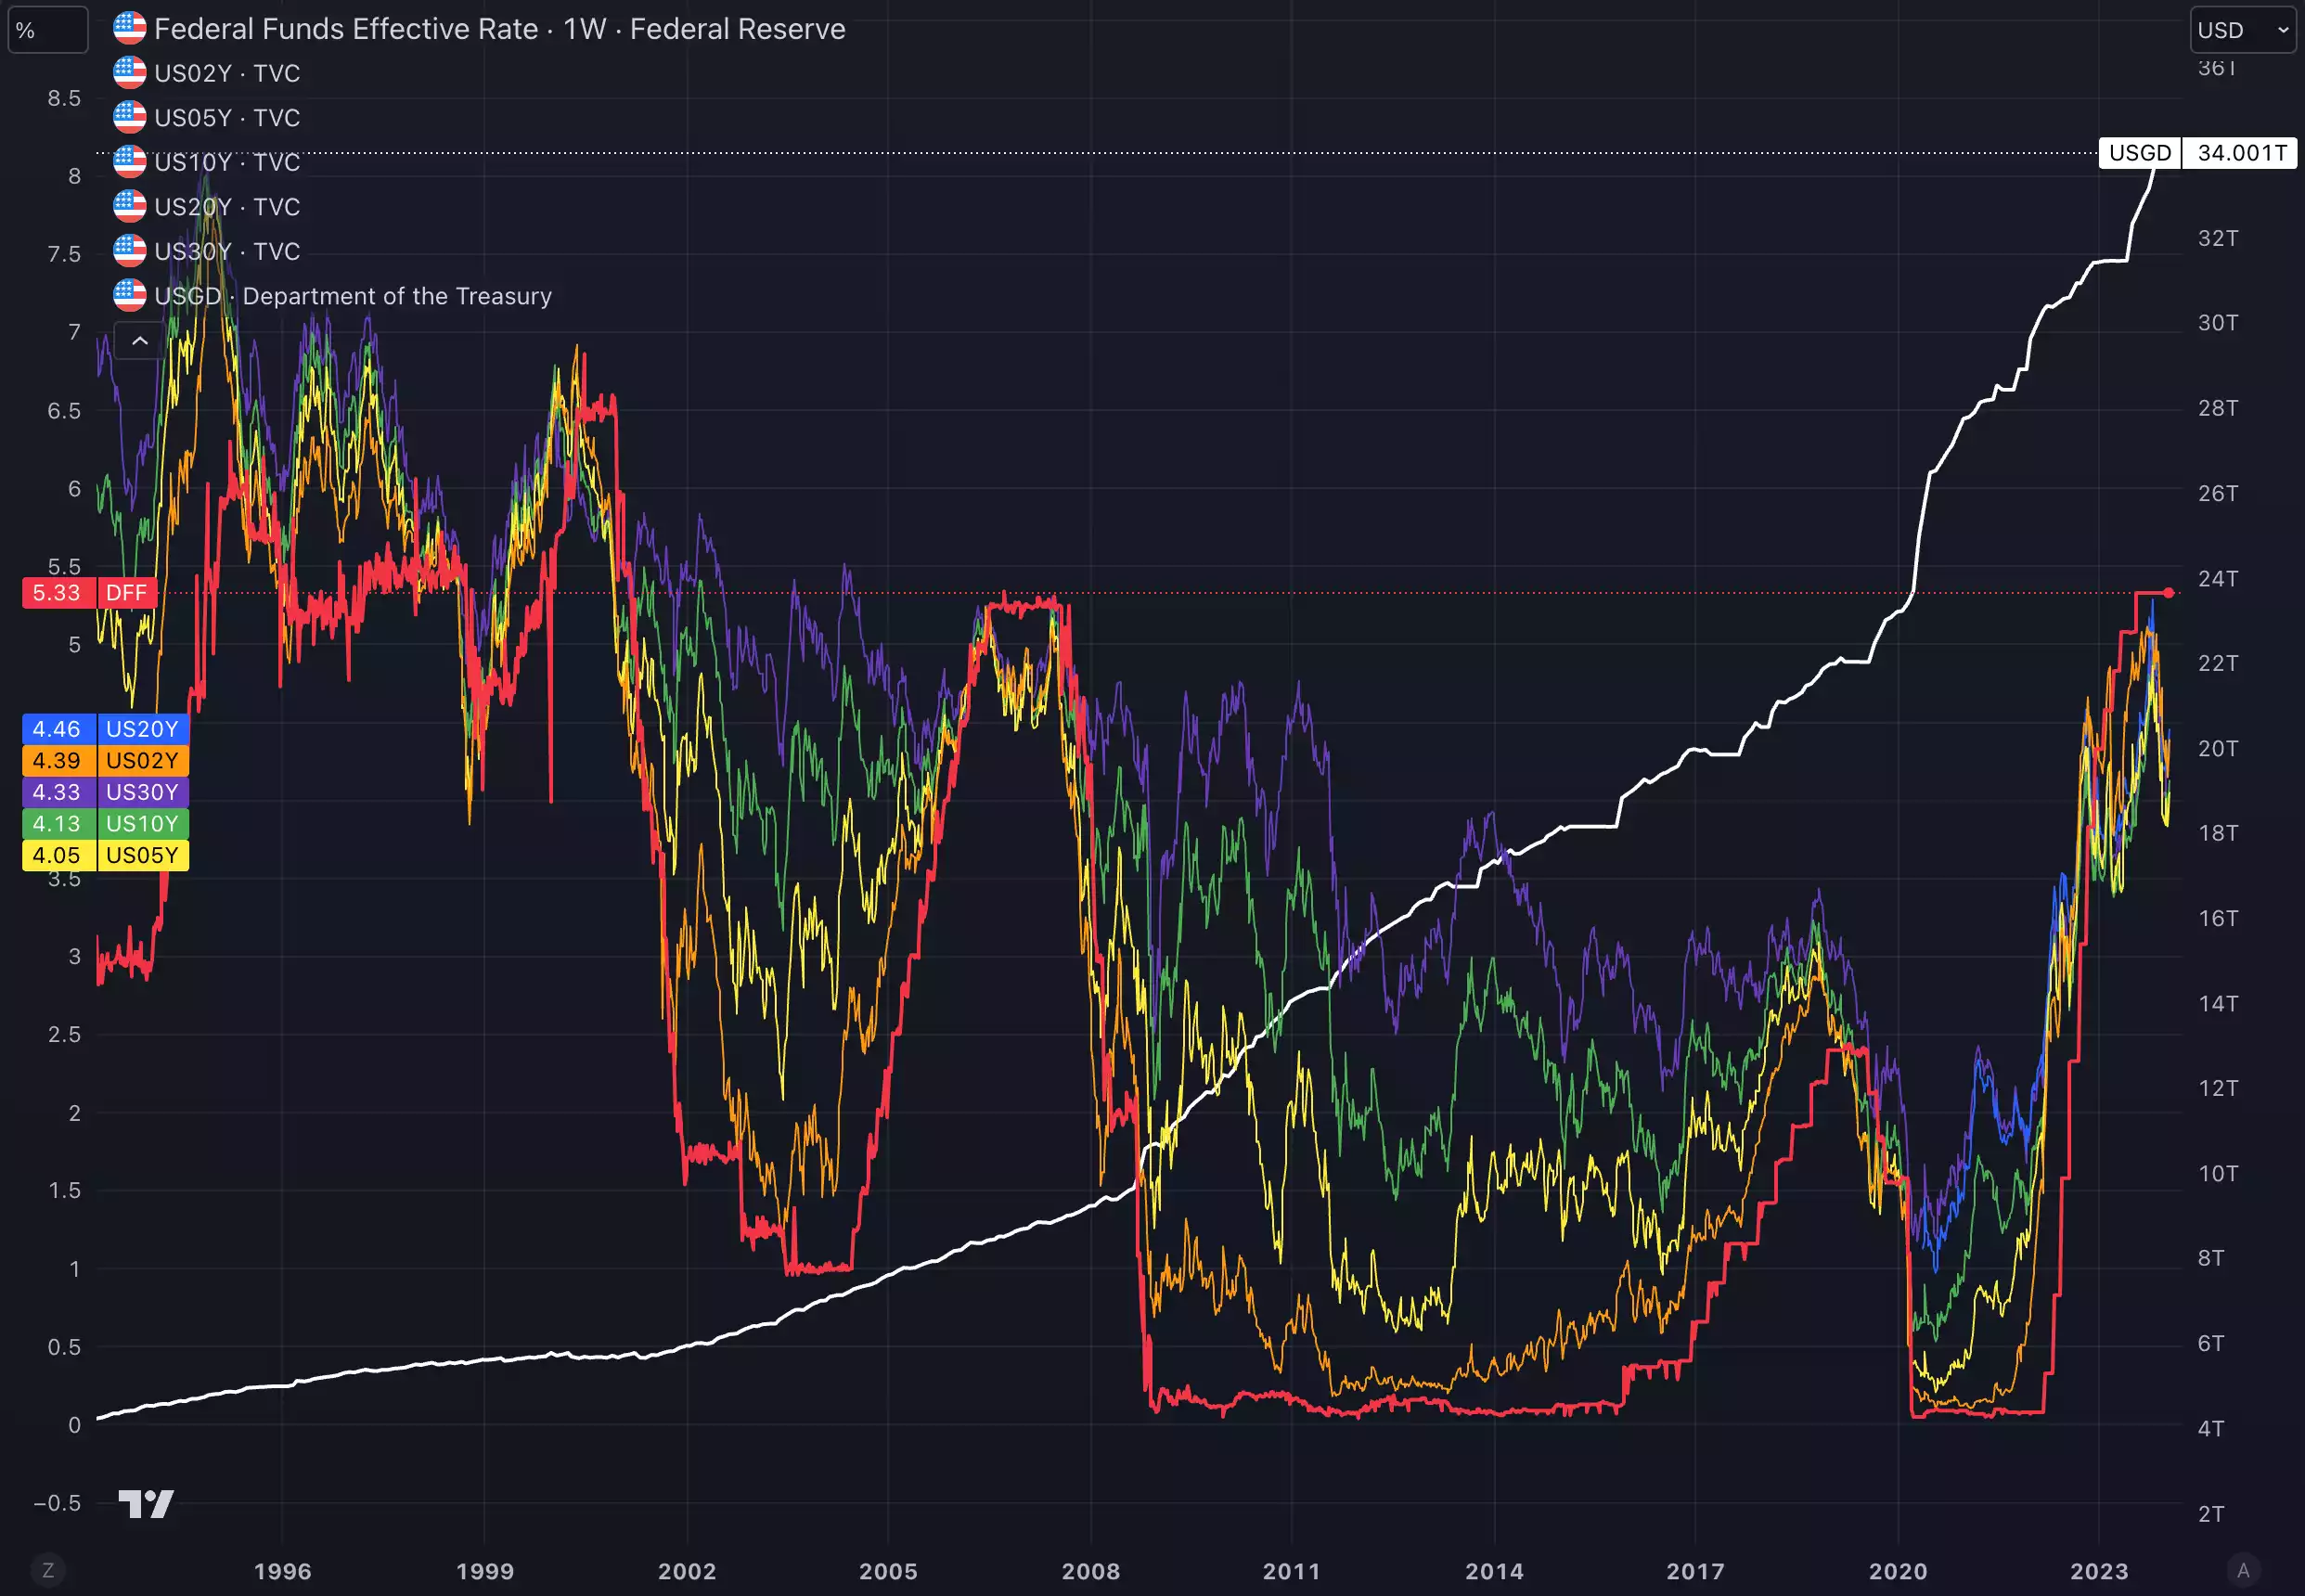
Global debt, highlighted through US Government Debt, continues on its “hockey stick” exponential path, which is making the Global Liquidity Cycle more pronounced but will create significant issues in the future and will be important to watch as we move through 2024
When you look at US Government Debt, as an example that the rest of the world is also following, we have now passed the point of no return where more monetary inflation will come as the interest payments on the debt alone ensure more liquidity must be injected to keep the entire system from collapsing. With no government seriously addressing the underlying issues, and as we head into an election year in the US where the incentives to continue spending are as high as ever, it becomes even more important to pay attention to the role of Monetary Inflation Hedges (specifically Gold and Bitcoin) to have any chance of keeping up with the certainty of further currency debasement ahead.
With the right tools to understand where we are in the cycle, the aim is to not only keep up with monetary inflation, but outpace it with significant profit
January 10, 2023: Buy Bitcoin at $17,179 USD. Current Gain of 142.1% over the past 377 days - as at the open of Monday’s candle ($41,583 – 22/01/24) - which is 137.5% annualised.
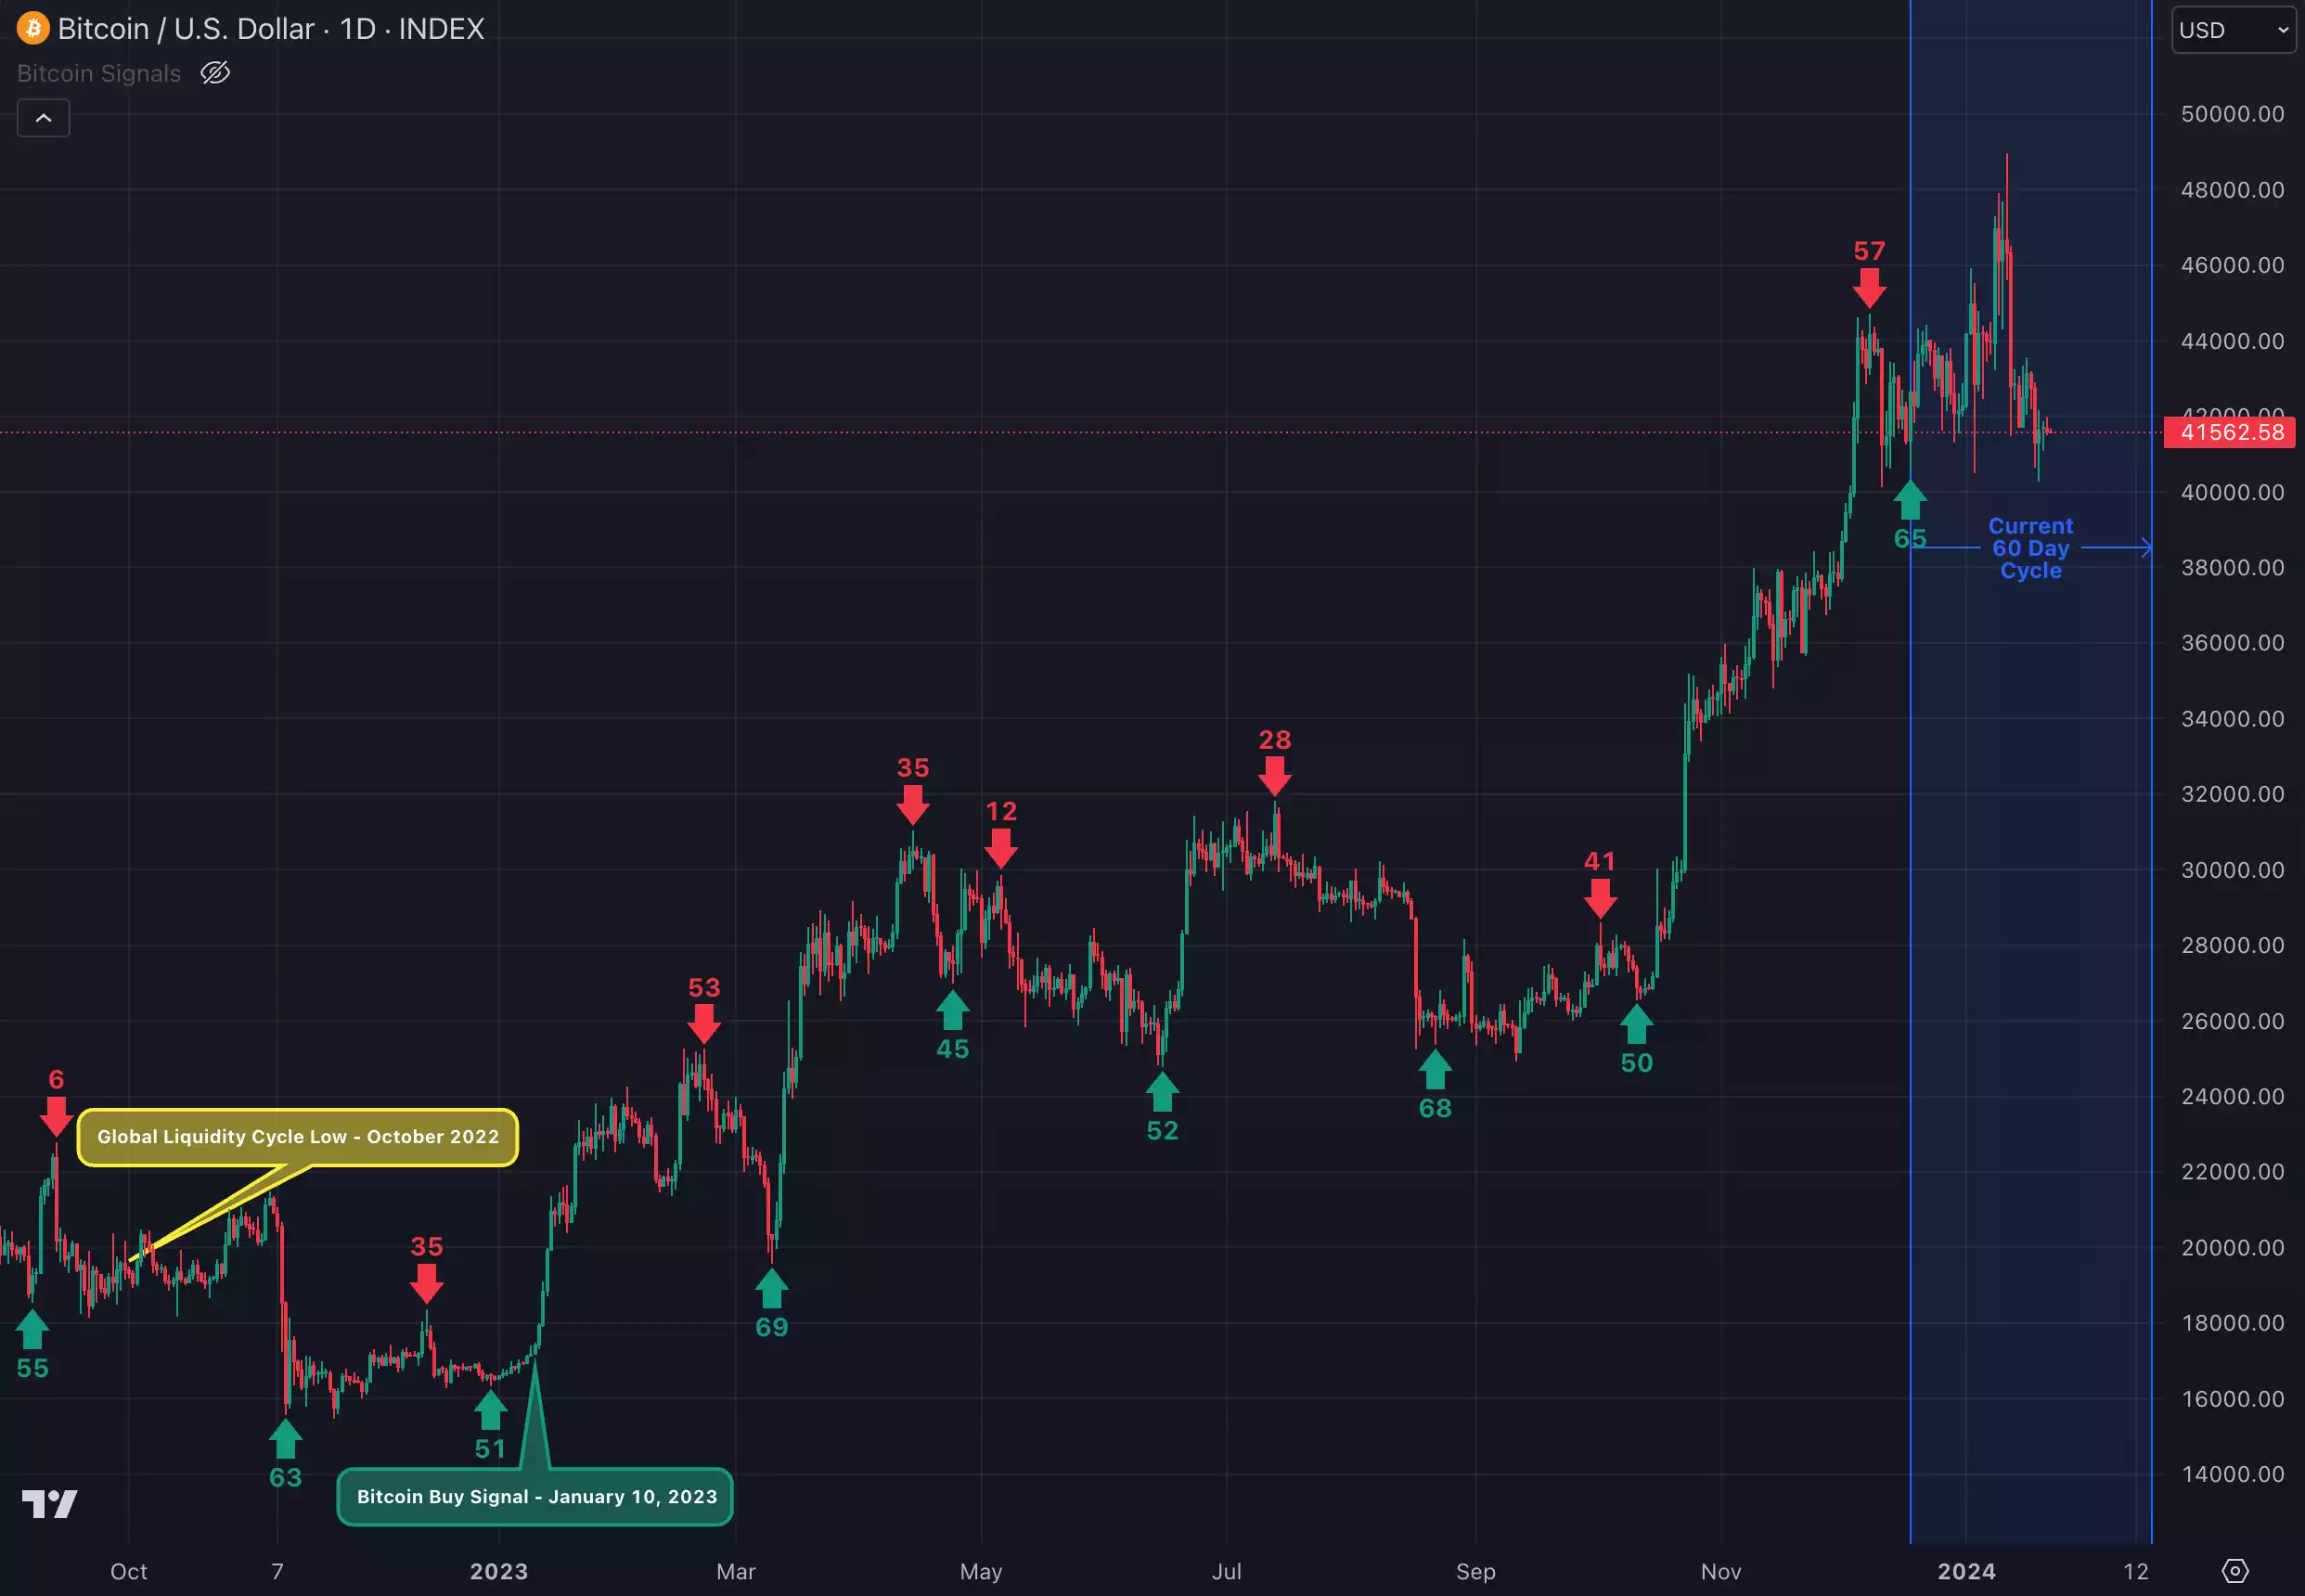
Watch the full presentation with detailed explanations on our YouTube Channel here: https://youtu.be/DvHBwQlR3vw
Note: the video presentation changed this month to a live format specifically designed to include much more comprehensive expert discussion and allow for a question and answer session at the end. We think it worked well for this first trial, and if you are interested in being involved in the next live session (currently planned for the Monday the 26th of February at 6:30pm AEST/7:30pm AEDT) stay tuned for an invitation link that will be sent out closer to the date. Our objective is to make the updates as valuable and specific to what people want to understand as possible, so as always feel free to reach out with any feedback to help us craft this into what best suits everyone.