What the Onset of a Rate Cutting Cycle Means for Stocks, Gold and Silver - A Flood of Liquidity
News
|
Posted 19/09/2024
|
2968
With the onset of a rate-cutting cycle and the U.S. dollar index hanging on by a thread - a flood of liquidity is right on schedule. While many have been on the lookout for an imminent collapse of markets due to a recession – we have been on the lookout for a flood of liquidity - causing all markets to rise - along with complacency and euphoria - only to be ultimately followed by a brutal and “unexpected” collapse - on the scale of the 2008 Global financial crisis.
While the world panics and makes decisions based on reactions to “unexpected” circumstances - those who can anticipate crises using objective data - can take advantage of generational opportunities in markets.
As we enter a stage where all markets rise in tandem, followed by a phase where most collapse - navigating markets can be made simple by sticking with assets primed for sustained uptrends during these choppy phases.
Crisis and Opportunity - Trading Gold, Silver and Stocks During a Global Financial Crisis.
Let’s reflect on the biggest financial crisis in recent history to illuminate the interplay between gold, silver and stock markets.
How did gold and silver fare, while most markets experienced disastrous devaluations during our most recent financial crisis?
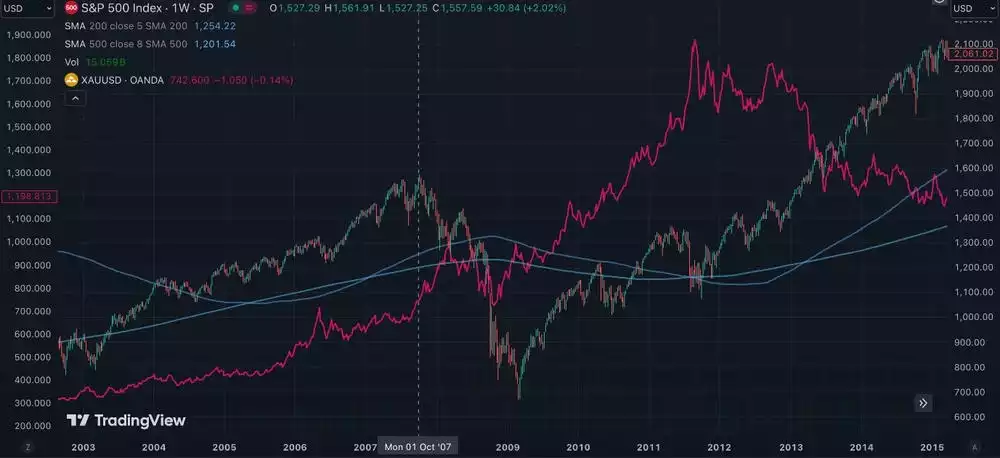
As gold is a global safe haven asset, and it also benefits from increased liquidity - This places it in the unique position where it gains value when liquidity increases in the euphoric phase (along with stocks) - and continues to gain value during the crash (while stocks and land take a beating). This is why gold, land, and stocks can move up in tandem for the euphoria phase while liquidity is increasing - but eventually, all the overleveraging and speculation in the system tends to cause a systemic crash (approximately once every 18.6 years) - often decimating the stock market - while investors seek shelter from the storm - in safe haven assets like gold and silver.
So, while gold and silver can experience some short-term volatility during the crash phase - their long-term uptrends tend to remain intact, as they continue gaining value during the crash - while stocks and land struggle - as investors and institutions seek shelter during the storm of systemic collapse.

During the GFC in 2008, gold (pink) continued gaining value while the S&P spent years recovering
Silver - the biggest opportunity flying under mainstream radar.
To understand silver’s position in this phase of the 18.6-year economic cycle. Let’s analyse how the Gold to Silver Ratio (GSR) performed during the last Global Financial Crisis.
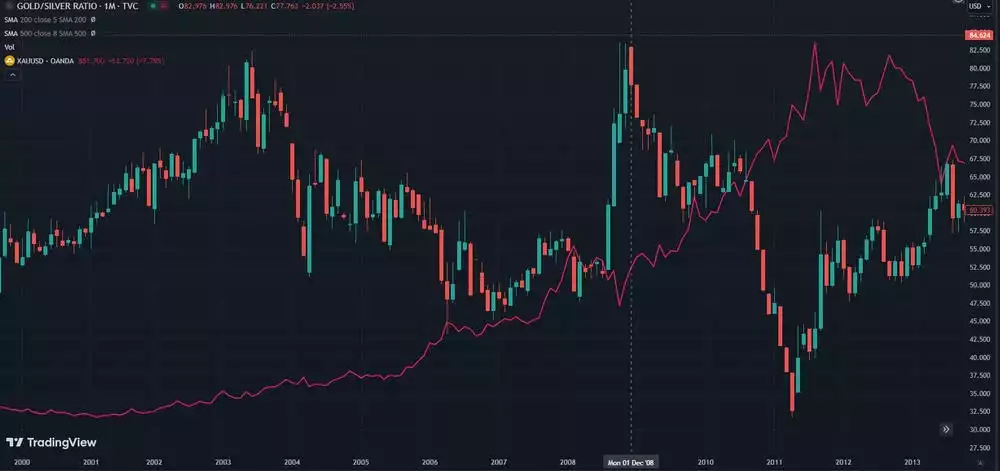
The GSR tells us how many ounces of silver give us one ounce of gold. When this ratio is high, silver is objectively undervalued when priced in gold. This provides an opportunity to buy silver, with the view of trading it in for gold, once this ratio falls off. There is widespread debate on the appropriate level for the gold-to-silver ratio, having ranged from 1:1 to 1:125 - where it should sit, would depend on who you ask.
When Sir Isaac Newton, who was Master of the Royal Mint, introduced a fixed ratio between silver and gold, the ratio he applied was 15.5:1. Regardless of what one believes the ratio should be at - if silver is bought when the ratio is high and traded for gold when the ratio is lower, investors have done well to capture capital growth while securing a hedge against inflation and systemic collapses.
We see major volatility in the gold-to-silver ratio during the last financial crisis. For 4 months, between August and December 2008, during the height of the GFC, when everyone was seeking shelter from the storm, the GSR shot up to 82, creating a generational buy opportunity for silver. Following this it fell to 35 as investors noticed precious metals outperforming almost every market, causing a generational bull run in silver markets.

The GSR (currently at 84) is a ratio that silver investors can use to track their swaps between gold and silver and one that will become increasingly relevant in this current and the upcoming phase of the 18.6-year economic cycle.