WGC - Gold Demand Trends Q2 2023 – Record High Gold Price
News
|
Posted 07/08/2023
|
3179
Q2 of 2023 saw the gold price seemingly doing little, so what happened ‘under the hood’? Today, as always, we present the World Gold Council’s quarterly Gold Demands Trends report. You can read last quarter here if you missed it.
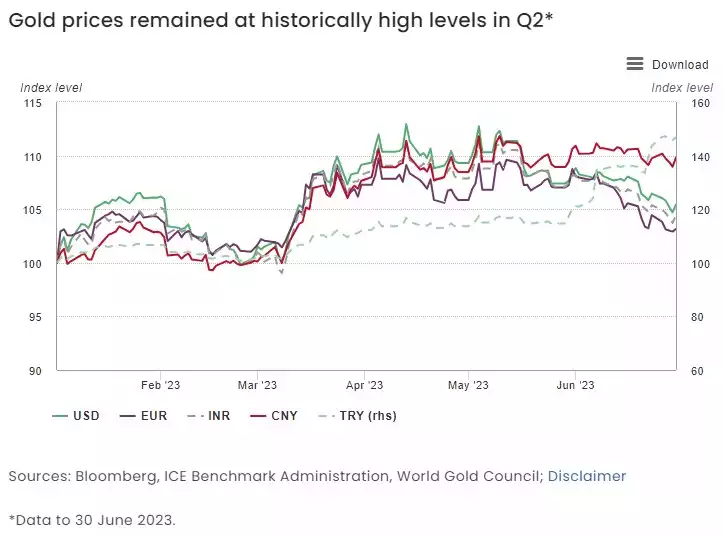
‘Seemingly little’ was a quite misleading as the gold spot price averaged US$1,976/oz during Q2, a record high for a quarter. This price was 6% higher year on year and 4% above the previous record high from Q3’20.
So what drove this?
Investment
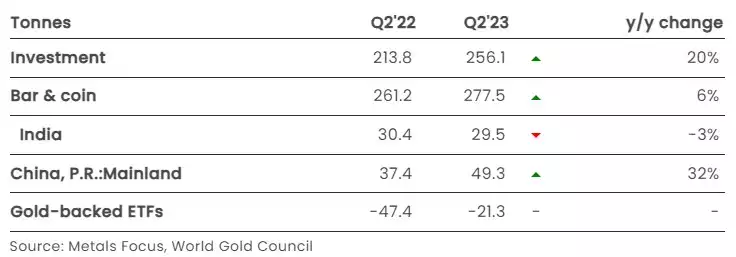
A healthy y/y increase in Q2 investment partly reversed the Q1 fall, thanks to decent growth in bar and coin demand and a marked slowdown in ETF outflows.
- Q2 investment demand was 20% higher y/y at 256t; this generated a 31% drop in H1 demand to 532t
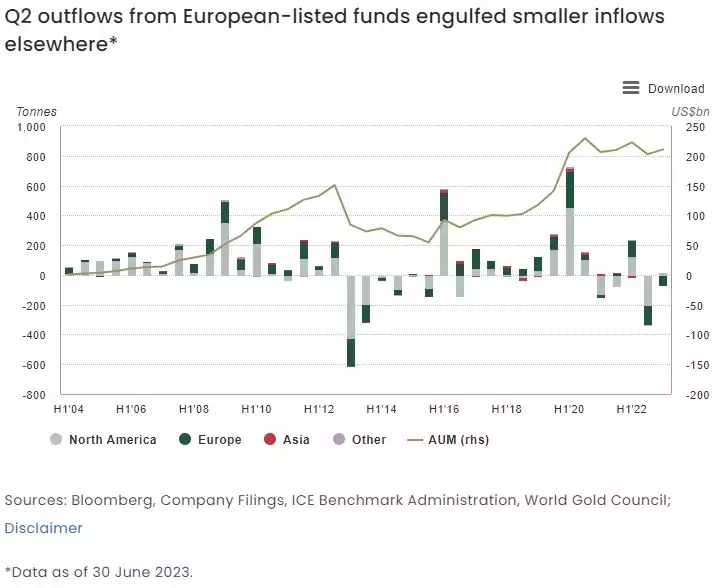
- April and May inflows into global gold ETFs reversed sharply in June; the net Q2 result being a modest 21t decline in holdings
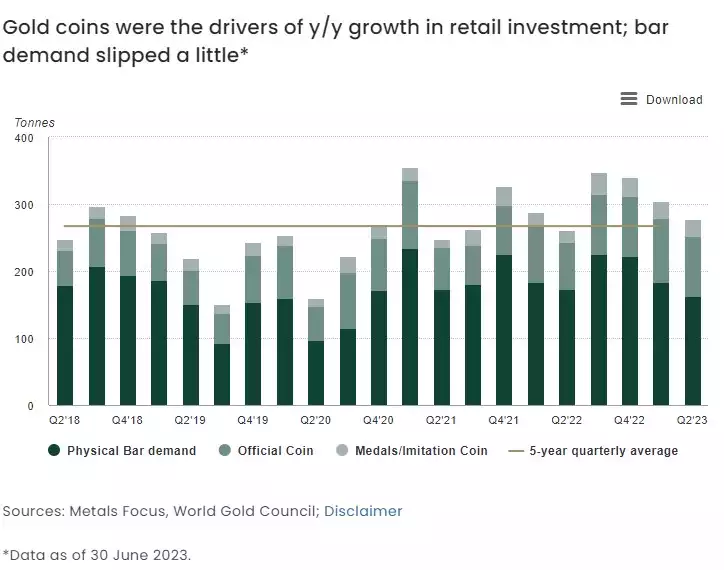
- Global bar and coin investment was 6% higher y/y at 277t, 4% above the five-year quarterly average.
As we know or you can see below, ETF’s can be a large contributor to demand. Gold ETFs ended their three-month positive streak with June’s sharp reversal. Contributing factors were strong performance from key equity markets, combined with a drop in the gold price in reaction to hawkish signs from major central banks.
Gold coin and bar demand was higher in most places in the world with the notable exception of Europe and Australia, the latter attributed “partly to the high gold price and partly to the intensifying cost of living crisis, both of which are reflected in a pick-up in two-way activity. Nonetheless, anecdotal reports suggest the appetite for gold remains intact.”
Central Banks
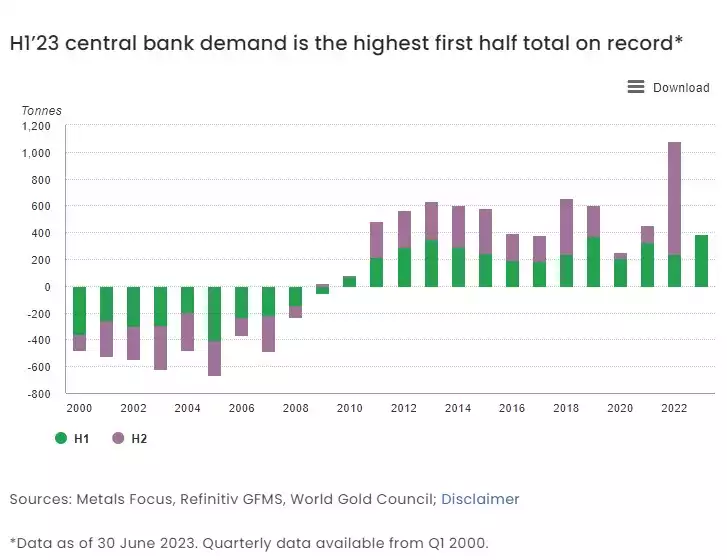
H1 23 saw the highest first half on record for central bank gold demand despite a softer Q2.
- Central bank net buying slowed to 103t in Q2, down 35% y/y
- Nevertheless, H1 central bank demand totalled 387t, the highest first half in WGC’s records back to 2000
- WGC’s latest annual survey results show central bank sentiment towards gold is still positive.
Jewellery
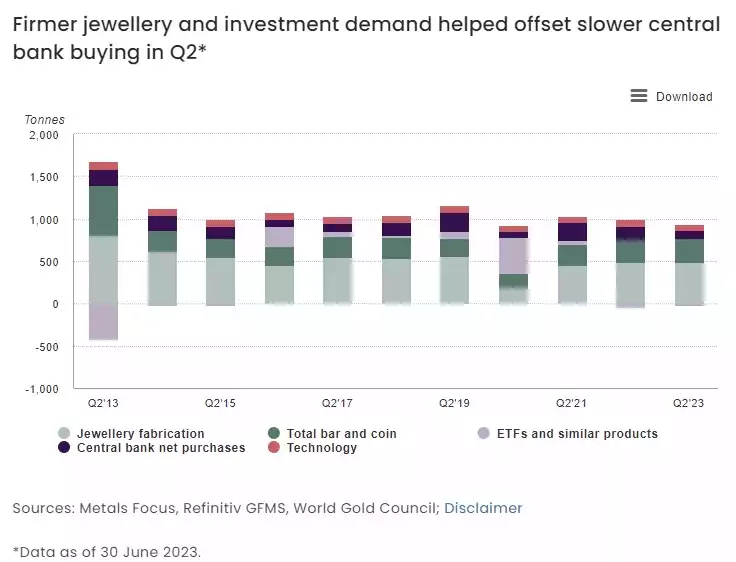
Jewellery demand, often price sensitive, proved resilient in the face of the record quarterly high gold prices.
- Jewellery consumption in Q2 strengthened modestly y/y, up 3% despite historically high (if not record) prices in most markets
- The H1 total for jewellery demand was also slightly firmer compared with 2022, primarily due to China’s recovery from the COVID lockdowns of 2022
- India, in contrast, was a drag on global demand as consumer demand softened in reaction to record high local gold prices
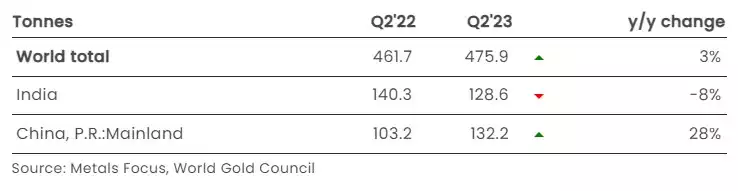
As you can see below, despite the pressures of a higher price and a tighter economy possibly weighing on demand, jewellery has remained relatively resilient:

Technology
Weak demand for gold in the technology sector continued into Q2, but early indicators of a potential recovery are emerging.
- Gold used in technology during Q2 fell by 10% y/y to 70t, finalising a very weak H1 demand of 140t – the weakest H1 in WGC’s data series
- The electronics sector, which dominates technology demand, fell 12% y/y to 56t
- Other industrial applications recorded a marginal 1% y/y increase to 12t, while dental demand continued its long-term decline, falling 10% y/y to 2t.

The weakness in gold demand in industrial applications carried into Q2 as surging inflation rates continued to severely impact the entire electronics supply chain, from chip manufacturers to end-users. H1 total demand of 140t is notably low, below even the COVID-impacted H1 of 2020. However, there are indications that Q2 may represent the low point of the downturn, with H2 expected to see some recovery as new products are launched and manufacturing ramps up to more normal levels.
Supply
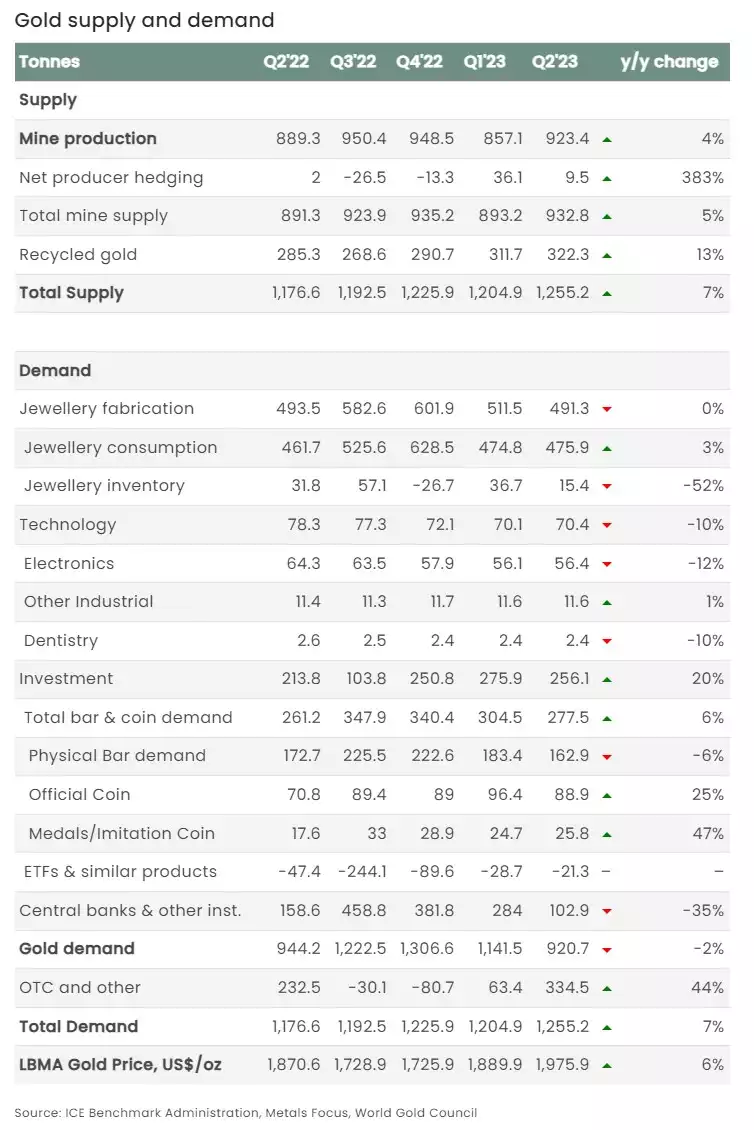
Total Q2 gold supply rose 7% y/y; mine production reached a H1 record
- Total gold supply increased by 7% y/y in Q2, driven by growth in all supply components.
- Total H1 supply was 5% higher y/y at 2,460t, driven by 3% growth in mine production to a record H1 level
- Recycled gold volumes in Q2 rose by 13% y/y, lifting H1 recycling to its highest level since 2016.
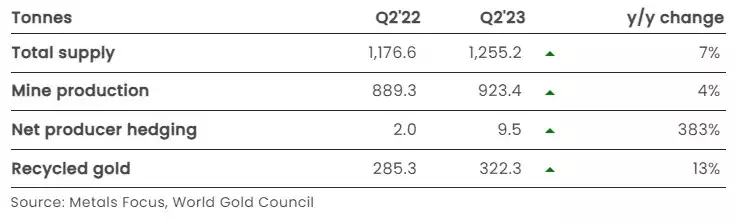
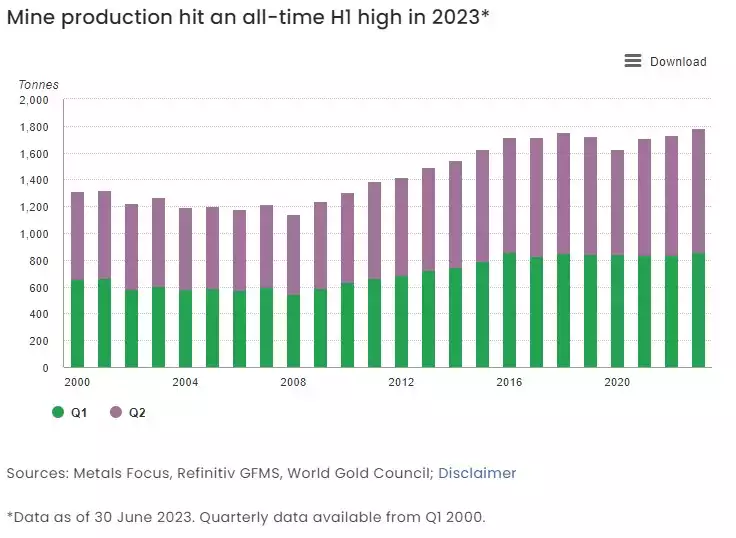
A big part of the increase was the unpredictable and unreliable sources of South Africa (continually affected by on again off again strikes and power outages) up 29% and Ghana up 20%. Russia too was up 7% but likely kept all production for its reserves.
The following table wraps all of this together: