WGC – Gold Demand Trends Q1 2023 – Central Banks Buy Big
News
|
Posted 11/05/2023
|
14140
Its that time again (already!?) for the World Gold Council’s quarterly Gold Demand Trends report, this time for Q1 of 2023. As usual we summarise the key takeaways for you as follows…
In essence it was continued strong demand from central banks, bar and coin investors and again offset by weakness in ETF’s as Wall St continued its ‘don’t buy gold when rates are high’ narrative, arguably without seeing the bigger picture. In aggregate that saw demand up 1% year on year but predictably down on those record breaking previous 2 quarters that made 2022 so extraordinary, as we reported here.
The extraordinary price growth across all key currencies affected most segments in some way.


Investment
Q1 saw diverging trends in gold investment demand: a small decline in gold ETF holdings versus hearty bar and coin buying.
- Investment demand of 274t was up 9% on the previous quarter, but 51% lower y/y
- Holdings of global gold ETFs fell slightly during Q1 (-29t); outflows in January and February were partially reversed by inflows in March
- Global bar and coin investment exceeded 300t for a third consecutive quarter – the first time this has happened since 2013.

You will note the big divergent moves in the 2 biggest gold markets.
China
“Q1 bar and coin investment soared in China. Demand totalled 66t, a 34% jump y/y and a 7% rise q/q, mainly driven by China’s emergence from the COVID pandemic and the eye-catching gold price performance
Chinese New Year generated robust demand for gold investment, particularly given the local gold price strength, which outperformed relative to other domestic assets including stocks, bonds and commodities. Additions to official gold holdings reported by the PBoC seemed to further encourage local interest in gold investment, as did elevated global geopolitical tensions. Furthermore, consumers’ high tendency to save may also have elevated their interest, as gold has historically been regarded as an effective store of value.”
India
“Record high – and volatile – local gold prices in Q1 were the key driver of gold investment demand, which was relatively muted at 34t. This resulted in a 17% y/y decline and a steep 40% drop q/q. In comparison with longer-term trends, demand was 14% below the five-year quarterly average.
The speed and scale of the rise in the local gold price deterred fresh buying and instead encouraged profit-taking for many. Furthermore, the low margins on gold investment products, relative to jewellery, meant that retailers concentrated their promotional efforts on the latter.”
And per above ETF flows stemmed:

Central Banks
Central bank demand makes a record-breaking start to 2023.
- Central bank demand hit 228t in Q1, 34% higher than the previous Q1 record, set in 2013
- This follows the record annual demand of 1,078t in 2022
- Buying during the quarter was reported by both emerging and developed market banks.

We wrote to the extraordinary buy up by Singapore in March here. However Singapore was far from alone.
“The Monetary Authority of Singapore (MAS) was the largest single buyer during the quarter. The addition of 69t, the first increase in its gold reserves since June 2021, confirms that buying in Q1 was not only the domain of emerging market central banks. Gold reserves at MAS now total 222t, 45% higher than at the end of 2022.
The People’s Bank of China (PBoC), disclosed that its gold reserves had risen by 58t. Since recommencing reports of purchases in November 2022, the PBoC has added 120t to its gold reserves, lifting them to 2,068t (4% of total reported gold reserves).
Turkey was again a big buyer of gold during the quarter: official reserves rose by 30t. Combined purchases of 45t in January and February were offset by a sale in March – the first since November 2021.3 15t of gold was sold into the local market following a temporary partial ban on gold bullion imports.4 Overall, this lifted total gold reserves to 572t (34% of total reserves).
The Reserve Bank of India also added a modest 7t in Q1, lifting its gold reserves to 795t, while the Czech Republic (2t) and the Philippines (1t) were also notable buyers.”
Jewellery
Global jewellery demand totalled 478t – unchanged y/y as growth in China met with price-driven weakness in India.
- Total jewellery consumption held steady against Q1’22, but was 24% lower q/q due to seasonal effects
- China saw vigorous buying: demand was 11% higher y/y at 198t as the removal of zero-COVID restrictions sparked consumers into life
- High and volatile gold prices proved challenging for jewellery consumers in several markets, most notably India, which saw the weakest Q1 since 2020.

Technology
Continued weakness in global electronics sales weighed heavily on demand for gold in the technology sector during Q1.
- Gold demand in the sector fell by 14% y/y to 70t during Q1
- This was primarily driven by a 15% decline in the electronics sector on weaker consumer spending
- Gold used in other industrial applications and dentistry also weakened, in part due to the higher gold price.

Supply
Total supply rose 1% in Q1 due to record mine production and higher recycling.
- Q1 mine production increased 2% y/y to a record level for the first quarter
- Gold recycling volumes rose by 5% y/y as the gold price increased
- Q1 saw a modest 8t added to the global hedge book owing to higher gold prices.
Whilst Q1 was a record quarter, it beat the previous record and the cornerstone of “Peak Gold” being 2016 by only a small whisker and bucked the trend that supported that thesis.

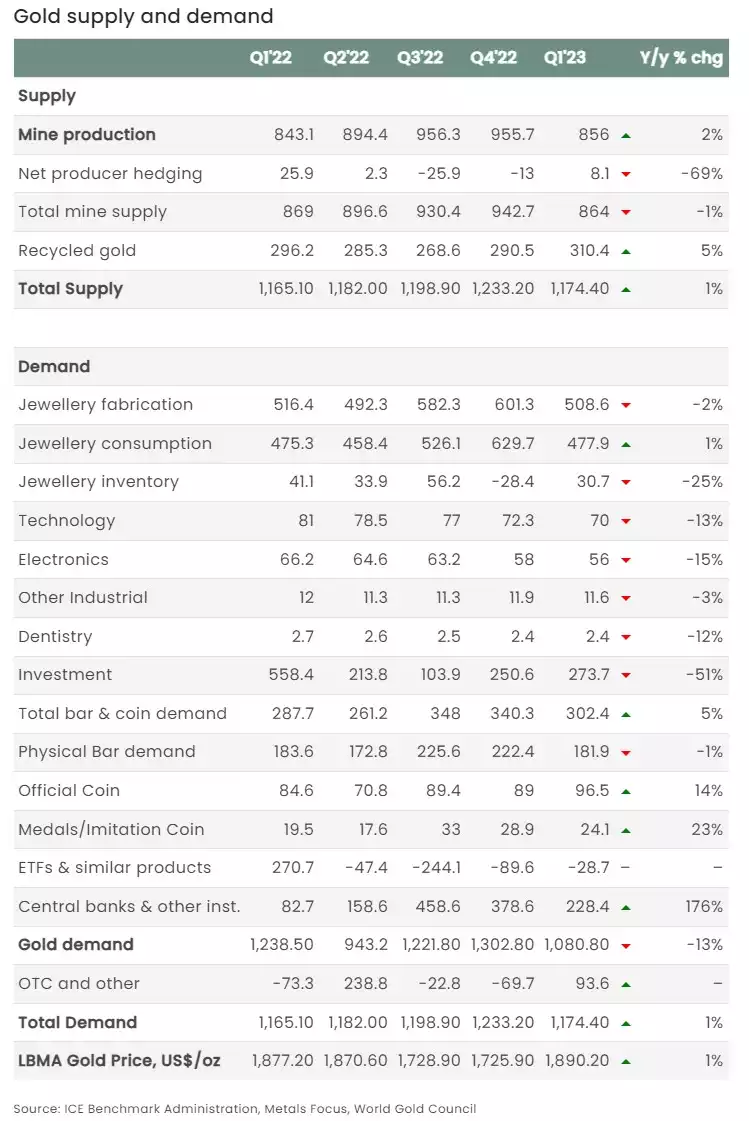
The following table wraps that all up in one snapshot: