U.S. Treasurer Yellen makes $2 trillion bet on lower rates sooner
News
|
Posted 30/01/2024
|
3184
Last night saw gold and bitcoin bid as the U.S. dollar sold off on the latest U.S. Treasury report pushing a lowering of supply ‘narrative’ which saw yields fall back in line with expectations of Fed interest rates. The market is catching on to the sooner than later rate cuts reality. If you want more confirmation that it will be even quicker than even the Fed think, look no further than ex Fed Chair and current U.S. Treasurer Janet Yellen’s actions.
First let’s set the scene with an update on this U.S. debt madness…
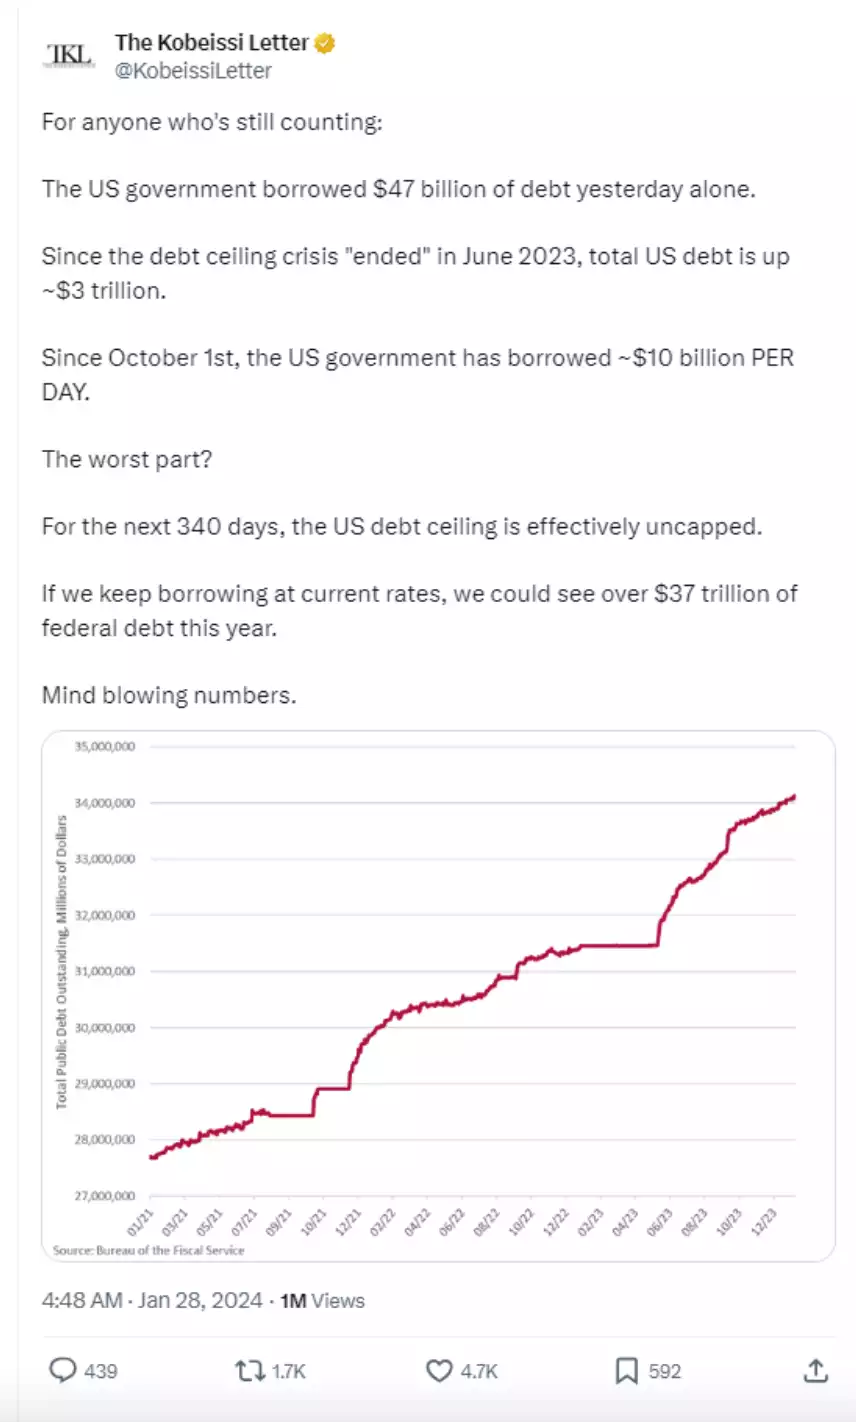
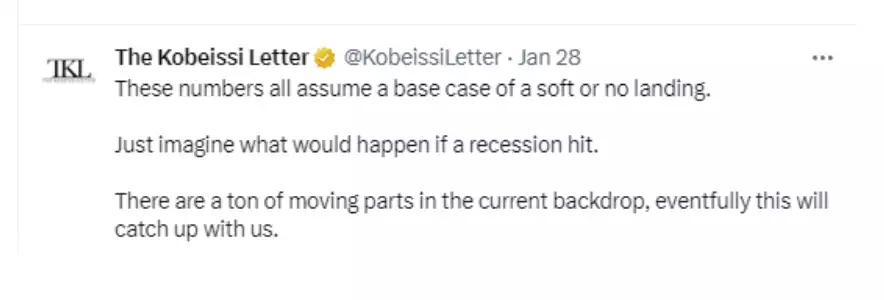
As a reminder, the U.S. Treasury funds the U.S. Government’s deficit spending given they spend more than they receive and have done so practically every year since 1969. They issue U.S. government backed Treasuries in the form of T-Bills (short term – 1m to 1yr), T-Notes (medium term – 2 – 10 yrs) and T-Bonds (long term – 20 – 30 years). Each pays interest and the higher the demand for them, the higher the price paid, the lower the yield.
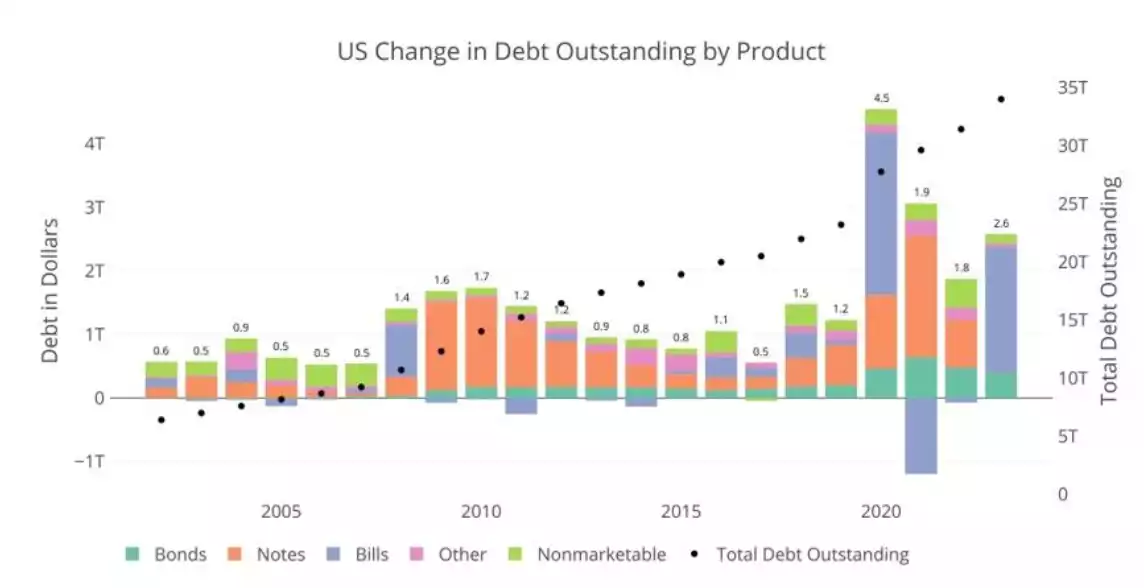
Last year the U.S. Treasury added US$2.6 trillion to their national debt. Whilst scary in itself, the make up of all the debt they sold to fund this massive deficit was abnormally skewed to the short end with US$2 trillion or 77% of it financed with short term Treasury Bills maturing less than a year. Normally the U.S. Treasury would use medium term Treasury Notes (2-10 year maturity) to fund their deficit spending, not short term Bills. The chart below shows just how abnormal that was with only the GFC and COVID responses coming anywhere near such a concentration of short term Bill funding.
Since the GFC the Treasury has tried to extend the maturity of its debt to ease out the frequency of having to roll over the debt (note roll over, never repay…). So, after all those efforts, why now are they so heavily going short term? The chart below reminds us of the role interest rates play in the equation and the redux of GFC…
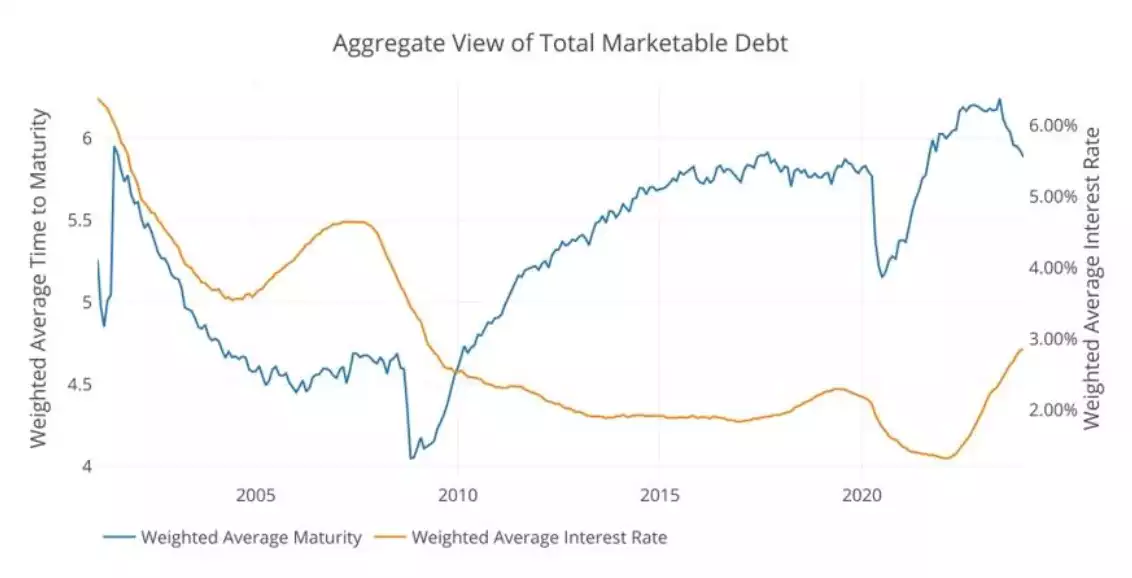
Regular readers will know we are currently in yield curve inversion territory where short term debt is paying more than long term debt, a phenomenon with a very high correlation with a recession ahead. So why, you may ask, would Ms Yellen choose to fund her Government’s largesse with a higher interest rate instrument? The chart below shows clearly that is around 1-1.5% higher than medium term Notes! So she is CHOOSING to pay an extra $30 billion in interest on her $2 trillion?
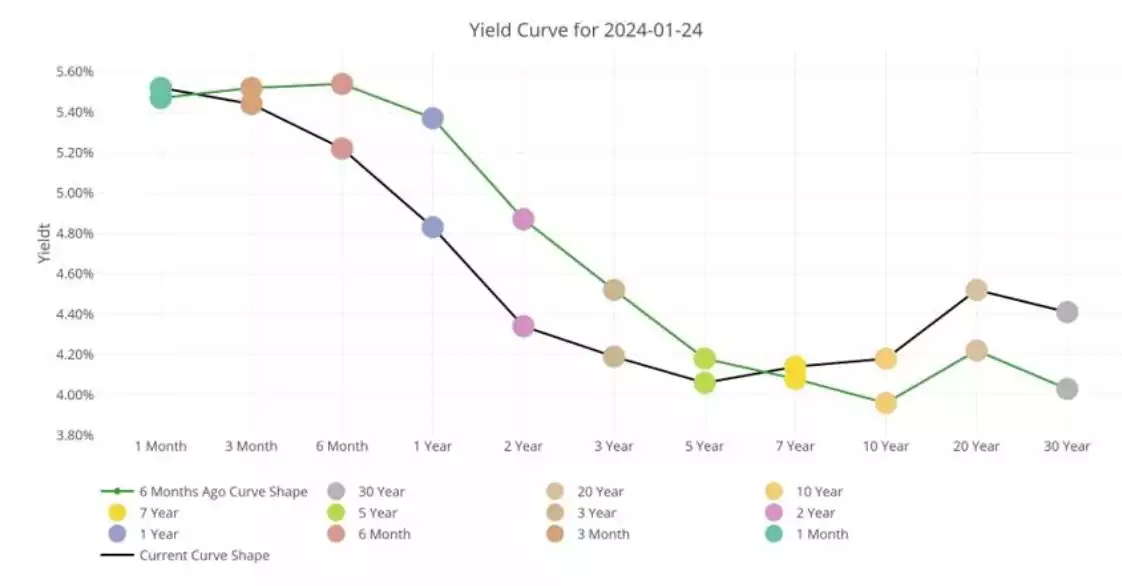
Part of this lies in the fact that the market can digest only so much medium term debt. We have written repeatedly about the world selling U.S. Treasuries not buying them. Bills are more easily digested by the market. The other part is the fact they need to roll these over on maturity given they can’t repay them. That needs to be like for like. The chart below shows the quite extraordinary events of 2020 where they had to both roll over US$2 trillion of debt and ADD another US$2 trillion. US$4 trillion in one year... Last year another US$2 trillion was rolled over and had they issued Notes not Bills we would have seen a repeat of US$4 trillion. Now look at this year, 2024. Yep, that is a record ever year of US$2.9 trillion of debt maturing that needs to be rolled over. US$2.9 trillion JUST to be refinanced….
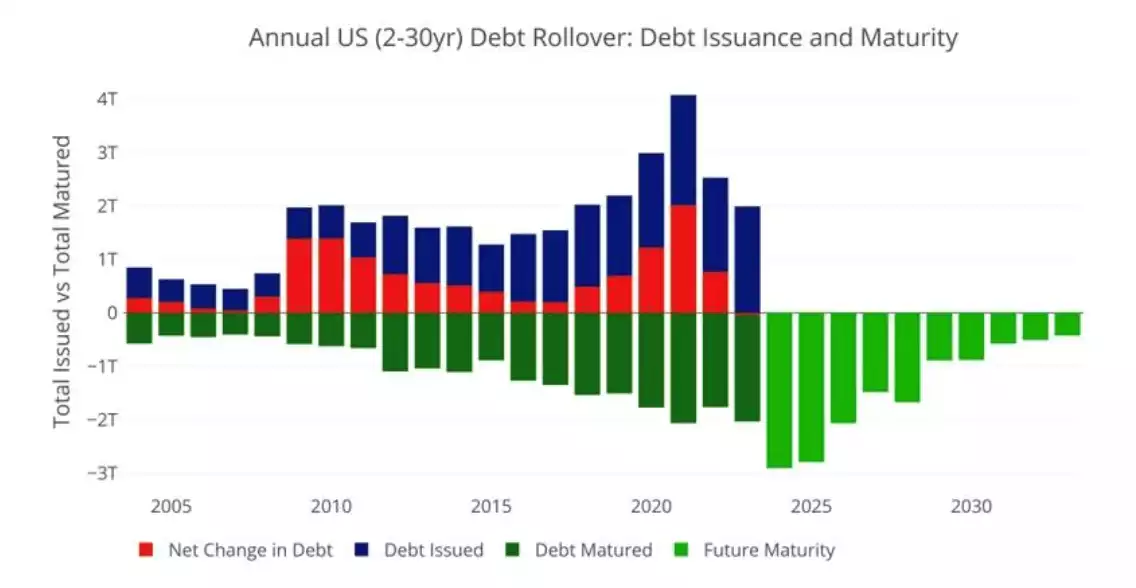
A more compelling reason is she knows longer term rates are set to fall and fall soon and fast. So why would she sell Notes and have to pay the 4%’s you see in the chart above when she know she can do that later (especially with that record $2.9 trillion this year) and pay much less? To put the sheer magnitude of this interest bill into perspective and the scale of the amount that is now short term Bills, check out the following chart…
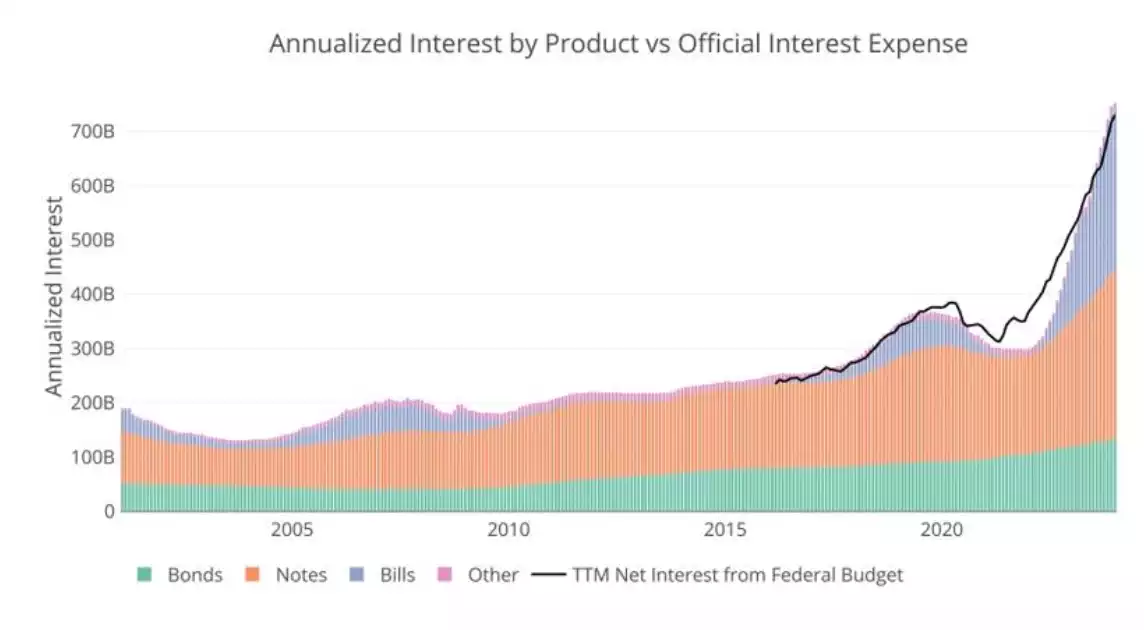
The Fed are forecasting 6 rate cuts reaching 3.5% by mid 2025 and in no particular hurry. The chart above and that below courtesy of the very same Fed forecasting a simply unfeasible debt interest bill of $900 billion by 2025 means that would be too little too late and it looks like Yellen is calling BS on it too. As a reminder, the Fed famously ‘pivoted’ in 2018 after its brief tightening foray saw the interest expense reach $400 billion… around half what’s dead ahead…
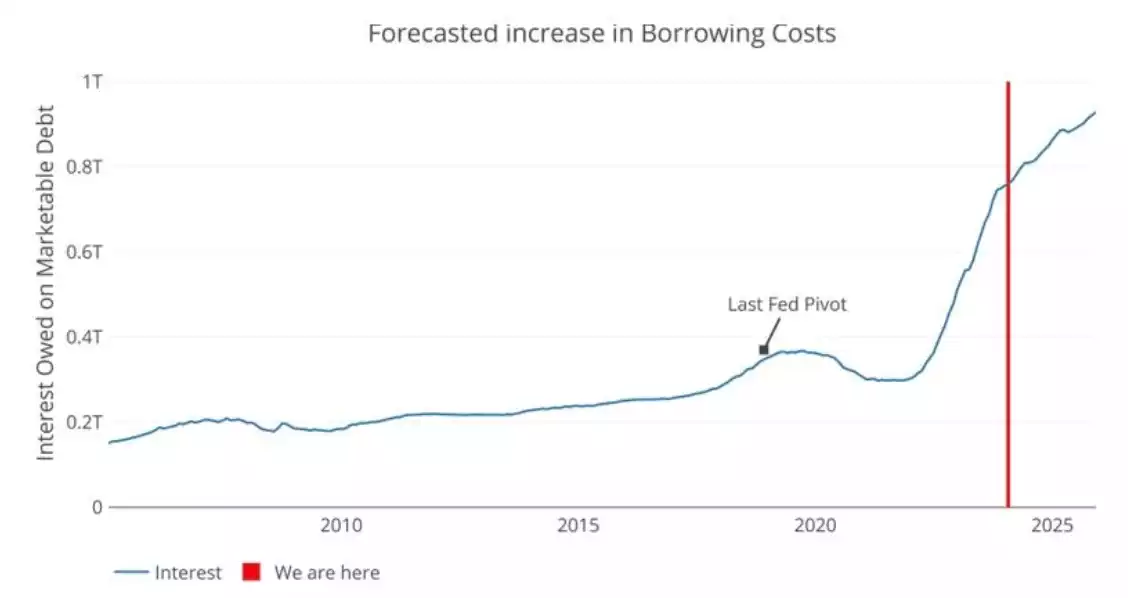
Love or loath her, Yellen has danced on both sides now, U.S. Fed Chair and U.S. Treasurer, and she effectively just made a $2 trillion bet that rates are coming down more and sooner than many predict. In isolation that may not convince you, but in combination with our own latest Global Liquidity Monthly it is confirmation of a very clear market trend and one that is hugely constructive for gold. Don’t do as they say, do as they do…