Silver’s Short-Term Pullback: Loading the Next Major Move
News
|
Posted 29/10/2025
|
2899
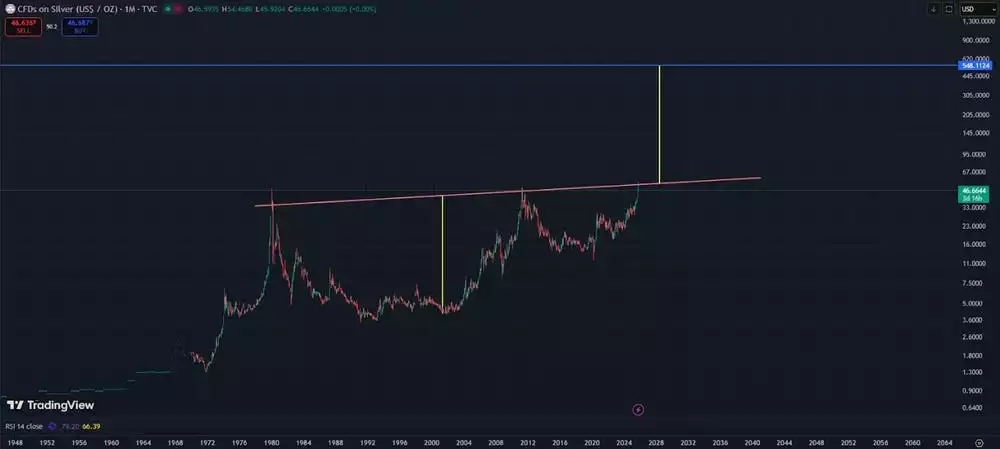
While silver’s recent surge has drawn attention, a broader perspective reveals that the macro move may still be in its early stages. A 50-year cup-and-handle pattern points to potential valuations above US$500/oz (AU$760/oz).

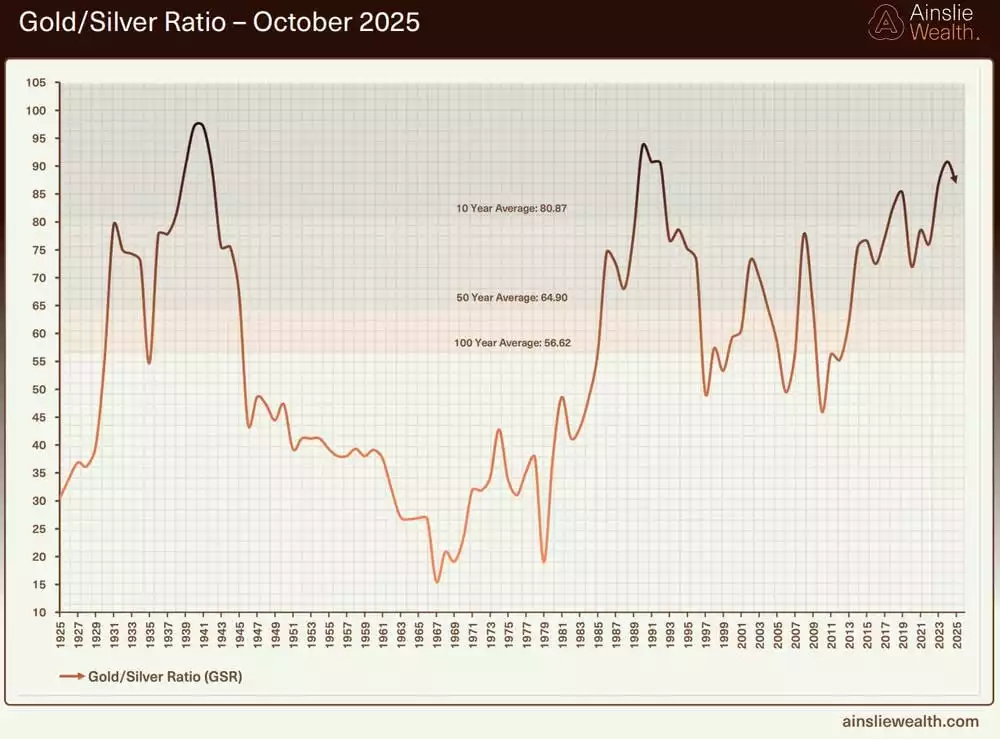
With gold’s long term (15 year) forecast being US$25,000/oz this would place the gold-to-silver ratio around its historical average of 50.

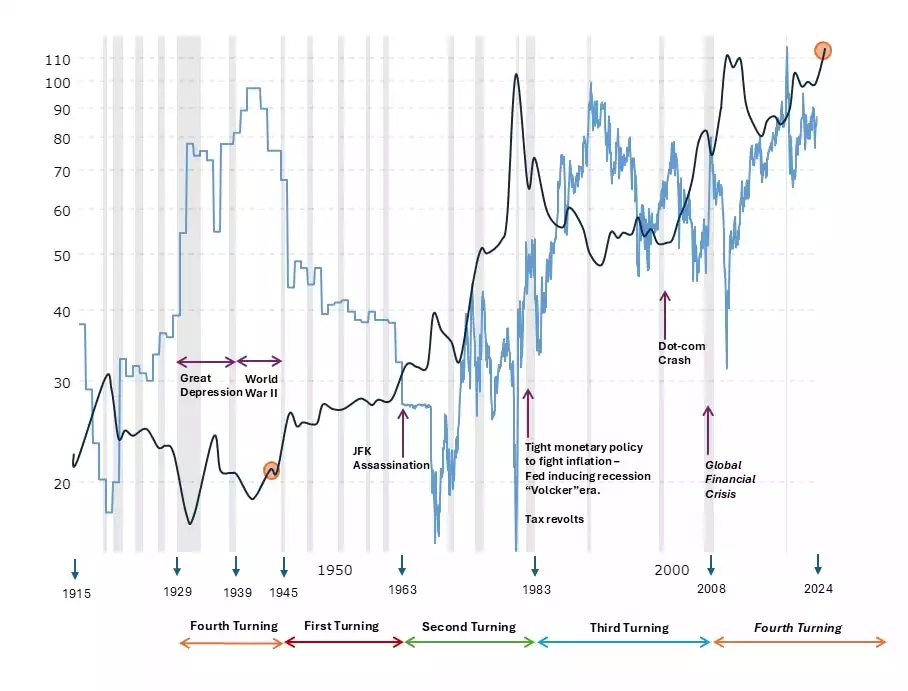
However, as we enter the next 80-year socio-economic cycle—known as “The Fourth Turning”—it’s worth revisiting how the gold-to-silver ratio has behaved during previous cycles.

The chart above shows that during the “first turning,” the ratio tends to drop well below its long-term average, and it remains low through the “second turning.” This suggests that if gold reaches US$25,000/oz, and the ratio falls below 50, silver’s US$500/oz target may only be the beginning of a multi-decade bull market—echoing the first 40 years of the current 80-year cycle.
Zooming in, the shorter-term 8-year cycle that began in 2022 is set to reach its midpoint in 2026. If history repeats, we could see a sharp rally emerging from that inflection point and extending into the latter half of the cycle. The next 8-year cycle, beginning in 2030, coincides with the onset of a new 80-year era—typically marked by a redefinition of the global financial order (as seen previously with the gold standard, World Bank, and IMF).
In this context, the upcoming cycle may offer just a glimpse of what’s ahead.
While short-term price action can be distracting, the long view makes one thing clear: for both gold and silver, the real move may still lie ahead. As we transition from one man-made system to another, history reminds us that it is timeless, God-given assets like gold and silver that have reliably helped preserve wealth and navigate upheaval for millennia.