Gold Spot Price to $7,700?
News
|
Posted 08/04/2024
|
5398
Gold Spot Price to $7,700?
Will gold come back down, or will it continue to go several times higher and potentially never revisit current levels again? We do not have a crystal ball, but we can look at gold's last 10-year bull run and potentially get clues.
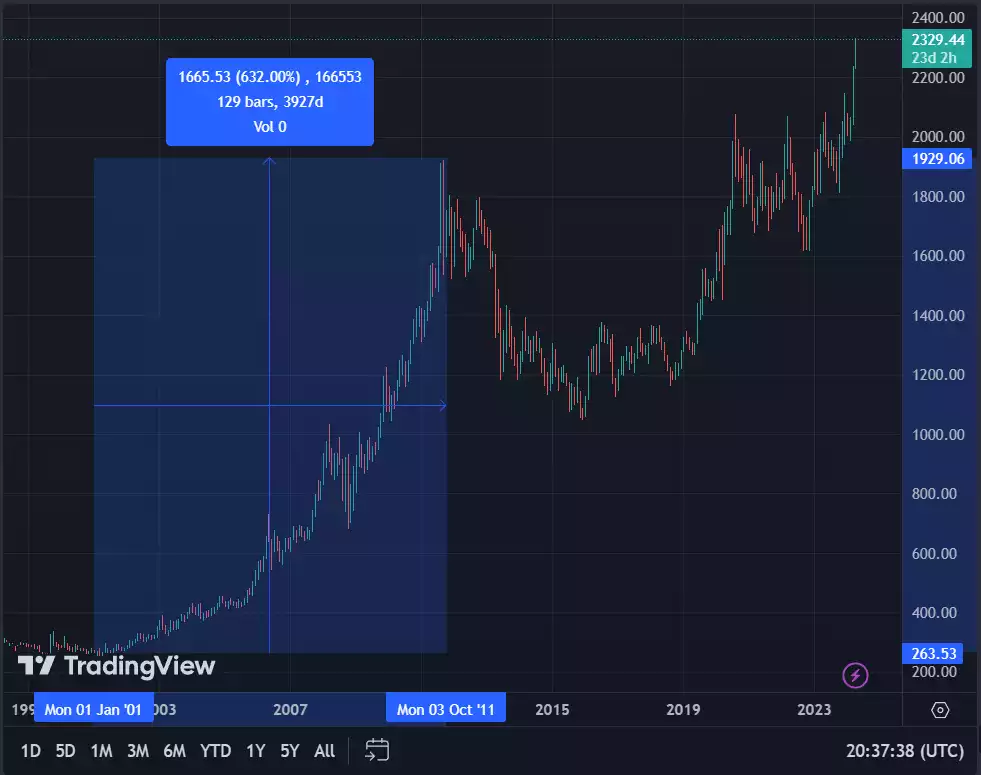
One can look to gold's roughly 10-year bull run from 2001 to 2011 and see a whopping 600%+ increase in the price. It would be difficult to believe at the beginning of that bull run that gold could go from a couple hundred dollars per troy ounce to being a couple thousand. Gold ascended from the hundreds to the thousands and then never went back.
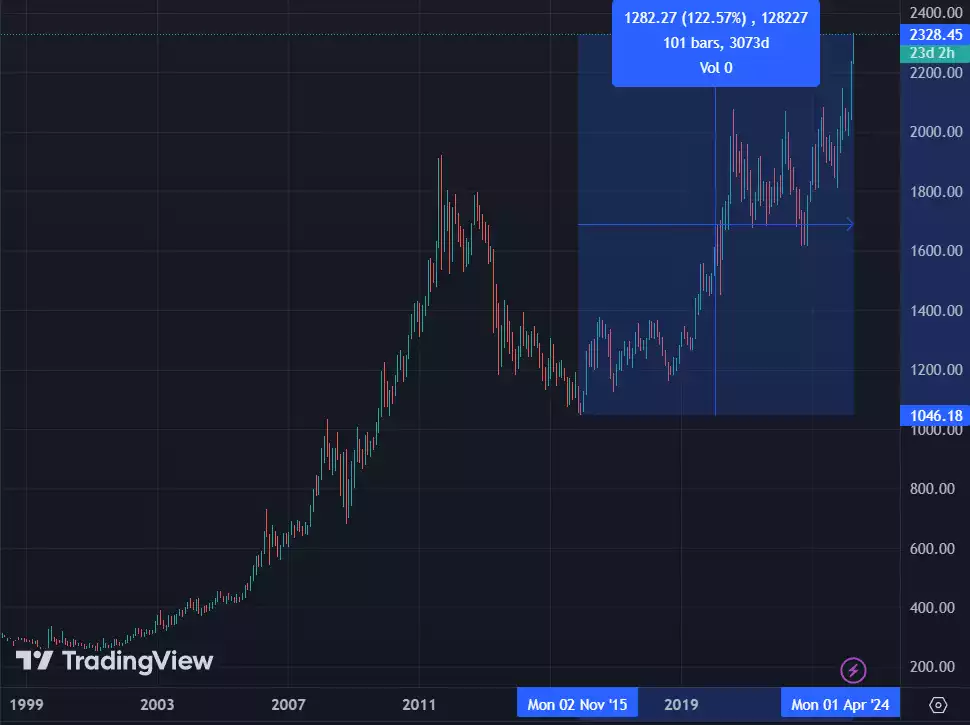
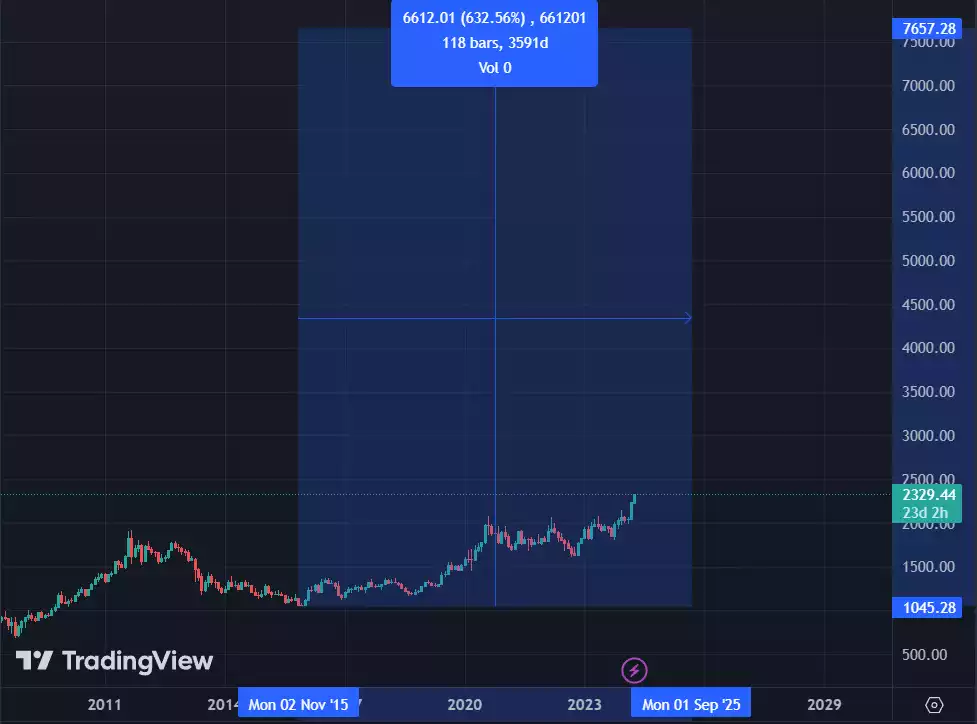
Now let's look at a similar timeframe of 10 years and start from gold's low point. Despite looking high in recent weeks, gold is actually only up just over 100%. If gold copied its last bull run, that leaves a target of roughly $7,700 per troy ounce within the next approximately 2 years. So, is gold actually far too low? We cannot know, but the previous bull run definitely trumps the current one by multiples.
This is where gold would reach if it mimicked its last run:
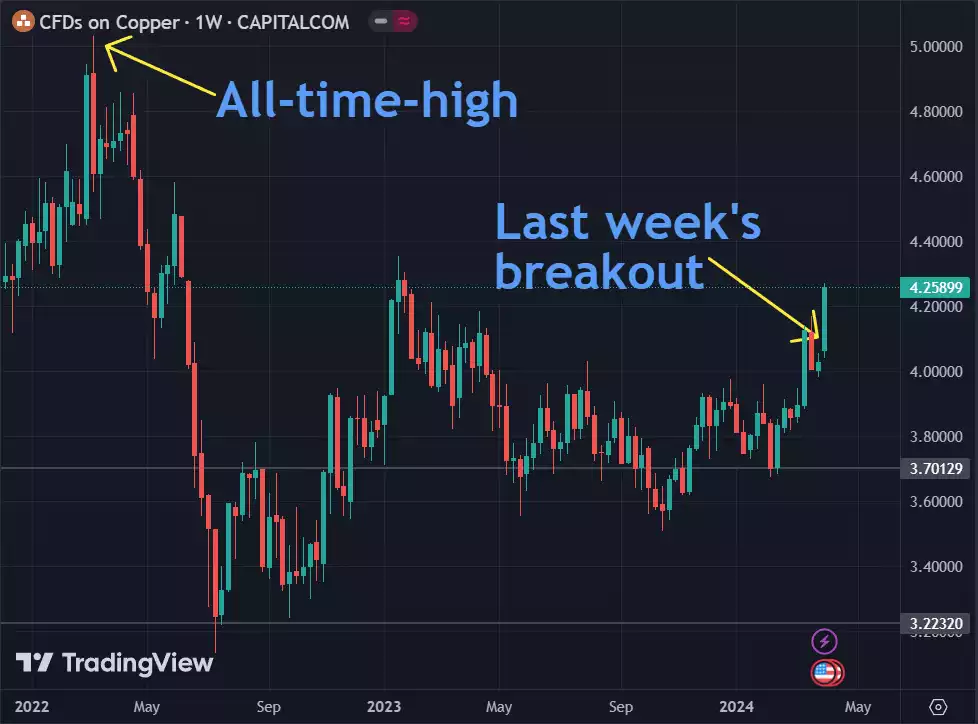
If gold will go up further, what can other charts tell us about when this might happen? First, let’s look at copper. Copper can be a great early indicator in stock market performance. If large copper orders have been coming through in the last week, this could mean that producers expect there to be ample consumption roughly eight months from now. This could imply that they expect an increase in money supply to stimulate buying.
Next, let’s look at the stock market itself. Not the S&P 500, but stocks which better tell the truth about what is happening for the majority of businesses and consumers. As you can see, the chart looks extremely similar to copper’s movements.
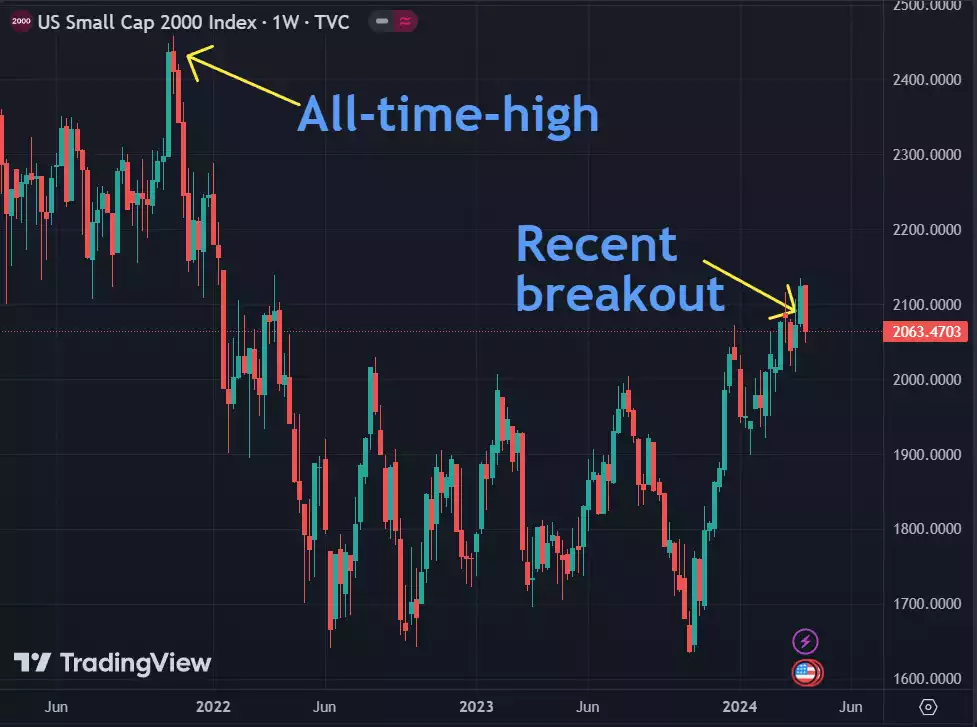
The Russell 2000 is often considered a better indicator of economic performance than the S&P 500 for several reasons. Firstly, the Russell 2000 index tracks the performance of small-cap stocks, which are typically more sensitive to changes in the domestic economy. This makes them a more direct reflection of economic health at the grassroots level.
The Russell 2000 also encompasses a wide range of industries and sectors, providing a more comprehensive view of the overall economy. This allows investors to gauge the performance of various sectors, including those that may be more indicative of economic growth or contraction, rather than just looking at the prices of Apple or Nvidia, for example. We wrote about the disconnect between the ‘Magnificent 7’ and the rest of the S&P500 here recently.
Small-cap stocks tend to be more sensitive to changes in economic conditions, such as shifts in consumer sentiment, interest rates, or government policies. As a result, movements in the Russell 2000 index may provide early signals of economic strength or weakness before they appear in larger-cap indices like the S&P 500.
If the Russell 2000 keeps following copper and copper is simply currently in the lead, this could also support the case for a general stock market rise, potentially supported by increased liquidity. This is historically a very strong buy signal for gold. Again, we do not have a crystal ball, but we will see across the next two years if fiat currency fights back and holds its value, or if history repeats itself and large-scale money supply increase leads to a further run for gold.
Whilst we don’t have a crystal ball, we do have Ainslie Research and the benefit of that analysis and the very tight correlation between gold a number of macro economic metrics and the Global Liquidity Index last updated here. It suggest very clearly this rally is just beginning.