Gold Hits All Time Highs – Smashes through “Bullish Pennant” Pattern
News
|
Posted 04/03/2024
|
4862
Gold has just completed forming and smashing through a rare pattern that technical analysts refer to as ultra-bullish. A "breakout" has just been confirmed on the weekend. Whilst hitting an all time high it looks like just the beginning of a bull run.
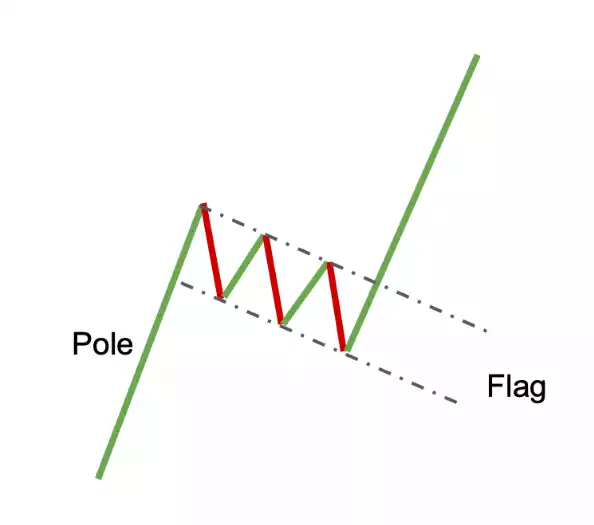
When most traders and investors think of a strong buy signal, they think of a "bull flag pattern". This is a somewhat common technical analysis chart pattern that occurs within an uptrend. It is characterised by a rise, then a flag-shaped consolidation or retracement that slopes slightly against the prevailing trend. The pattern is often interpreted as a brief pause or consolidation before the uptrend resumes. Traders consider the breakout above the upper boundary of the flag as a buy signal.

-Changelly
Bullish Pennant Pattern
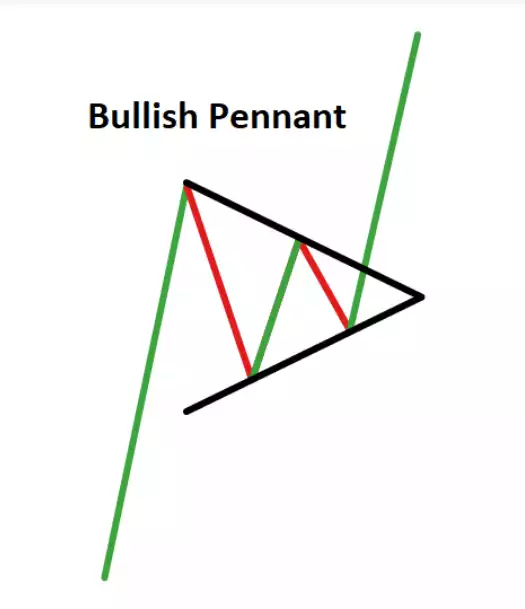
A much rarer and much stronger pattern is the "bullish pennant". The pattern is similar to a bull flag but is more symmetrical. It forms after a strong upward price movement and consists of a small symmetrical triangle/pennant-shaped consolidation. This consolidation is created by converging trendlines, representing a brief pause in the market. The bullish pennant pattern is considered a continuation pattern, indicating that the previous uptrend is likely to resume after the consolidation period. Traders typically view the breakout above the upper boundary of the pennant as a signal to go long. These patterns are often identified on smaller timeframes, such as hourly or 4-hourly charts, however the longer the timeframe, typically the stronger the pattern.

-DailyFX
Gold
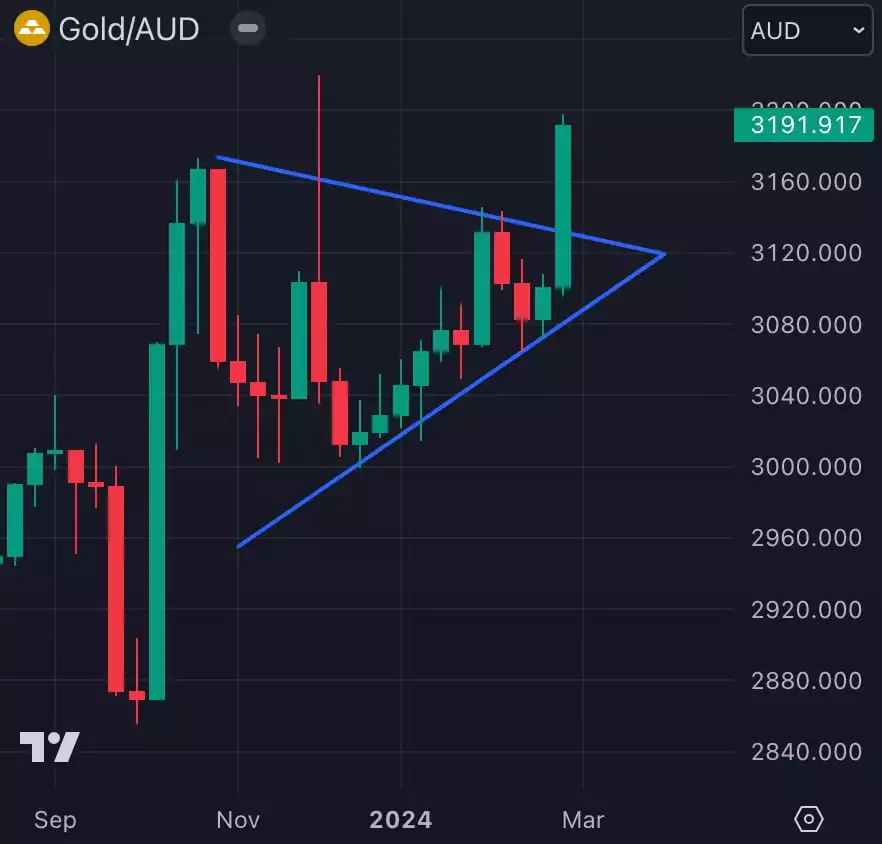
Gold has just formed a bullish pennant pattern and it has done so on a weekly chart - one of the biggest timeframes. What traders and investors may now look for is a "breakout". As pressure builds, the price action could either burst out of the pattern downward or upward.
The big news: Gold's price has already broken out upward, which could signal a further rise to all-time-highs. On Friday night, the close above the blue line pictured, particularly with the vengeance with which it did it, indicates a strong buy signal according to technical analysis techniques.

Why Bullish Pennant Pattern is a Stronger Buy Signal
The bullish pennant pattern is often considered a stronger buy signal than a bull flag pattern for several reasons:
Symmetry, Consolidation & Shape:
The symmetrical shape of the pennant suggests balanced supply and demand. This symmetry indicates that market participants are uncertain but, when the breakout occurs, it may result in a more significant price move compared to the flag.
Tighter Consolidation:
The consolidation within a bullish pennant is typically tighter than in a bull flag, indicating a more compressed range of price fluctuations. This tight consolidation often precedes a more explosive breakout, potentially leading to a stronger and more sustained uptrend.
The symmetrical nature of the pennant implies that buyers and sellers are in balance, creating potential for accelerated momentum when the breakout occurs. This can result in a more dynamic price movement compared to the more gradual trend resumption in a bull flag.
Why Do Traders Rely on These Patterns?
Are these patterns reliable, or simply superstition? Imagine a rope in a physical education class. Students must climb the rope all the way to the top to succeed. One student begins climbing and makes it a few meters up the rope, then slides all the way back down to the floor. How are things looking? It looks like the student will not make it to the top. This is like a boom and bust in a stock price that over promises and under delivers.
Now picture another student climbing a few meters, then stopping to breathe and rest and they slide down just a couple centimetres. Then, they burst upward again several meters and stop for another rest. This looks much more promising. This is similar to the movement of a bullish pennant and observed properly, it makes clear sense why this is a strong pattern.
It's important to note that while these patterns provide signals. No pattern guarantees future price movements, and traders should use additional technical analysis tools and risk management strategies when making trading decisions. Luckily for Ainslie readers we do exactly that and indeed just released the latest Ainslie Research - Macro and Global Liquidity Analysis: Gold, Silver, and Bitcoin for February 2024 which steps you through the macro drivers of these markets in clear terms.
(Spoiler alert – it indicates we are now in just the early stages of a bull market for gold and silver. It’s a must watch if you haven’t already.)