Macro and Global Liquidity Analysis: Gold, Silver, and Bitcoin - February 2024
News
|
Posted 01/03/2024
|
7087
Today the Ainslie Research team (ainslie.to/research) brings you the latest monthly update on where we are in the Global Macro Cycle, driven by the Global Liquidity Cycle, and the implications for Gold, Silver, and Bitcoin. This summary highlights the key charts that were discussed with our expert panel in the live video conference on Monday night. We encourage you to watch the recorded video of the presentation in full (https://youtu.be/qSQnLsNlayI) for the detailed explanations and audience Q&A.
Where are we currently in the Global Macro Cycle?
We remain in the Early Cycle phase of the Global Macro Cycle, and still well below the halfway line.
This is consistent with what we are seeing in terms of economic growth in the U.S., as evidenced by the ISM. When looking at the leading indicator we expect this to continue heading upwards for March…

and accelerate even further over the next 3 months.

In terms of U.S. inflation, the Truflation data (which leads the government reported rate) continues to remain stable and within the Federal Reserve’s stated target range, so the official inflation data is likely to continue to surprise to the downside in the months ahead, supporting the case for a new rate cutting cycle.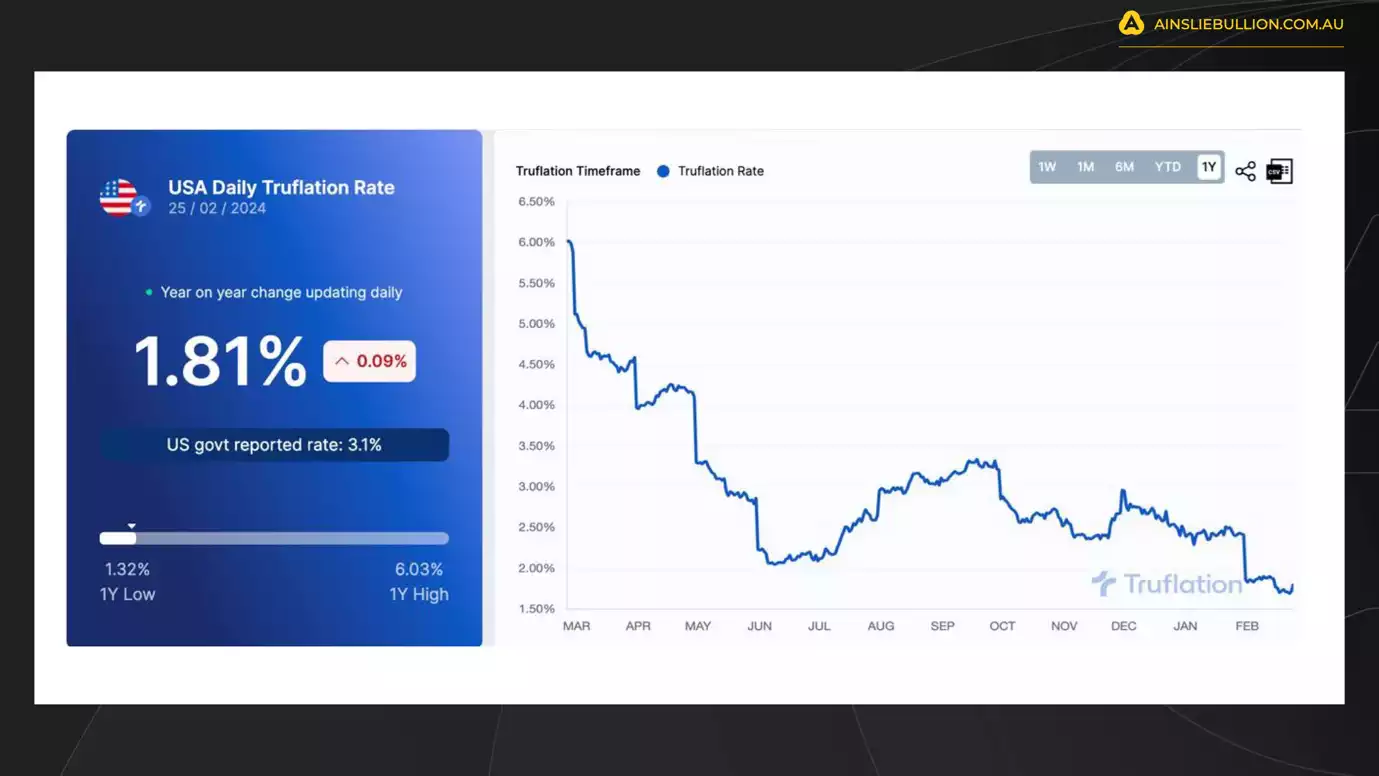
U.S. government debt remains on an unsustainable, and increasingly exponential, path higher.
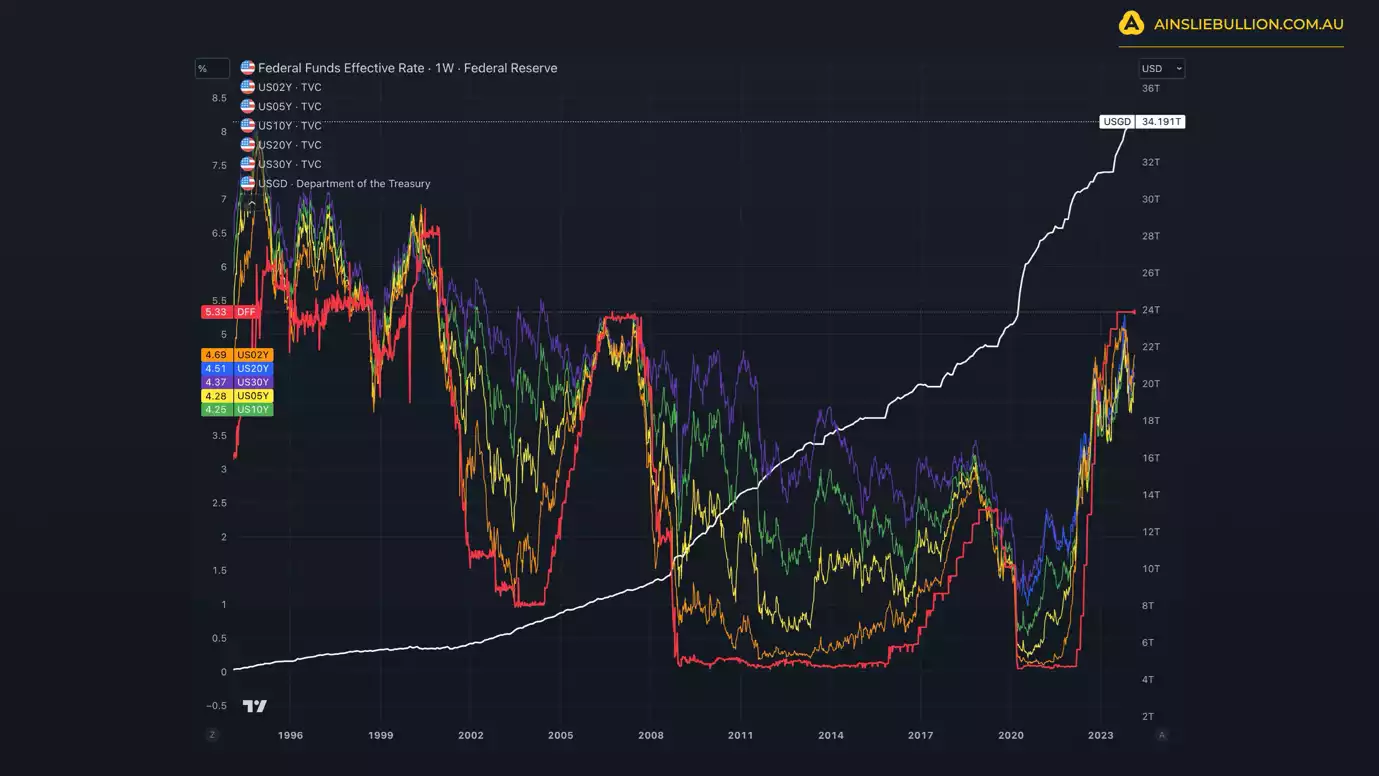 This is particularly alarming as bond yields appear to be rising again, likely reflecting concerns over the debt situation, and leading to a lack of interest in purchasing U.S. government debt right at the time where new supply needs to be released. For now, things are stable, but ultimately we are on the lookout for issues to arise later in the year if yields don’t fall alongside the official Fed Funds Rate as you would usually expect (indicating the bond market is “broken”).
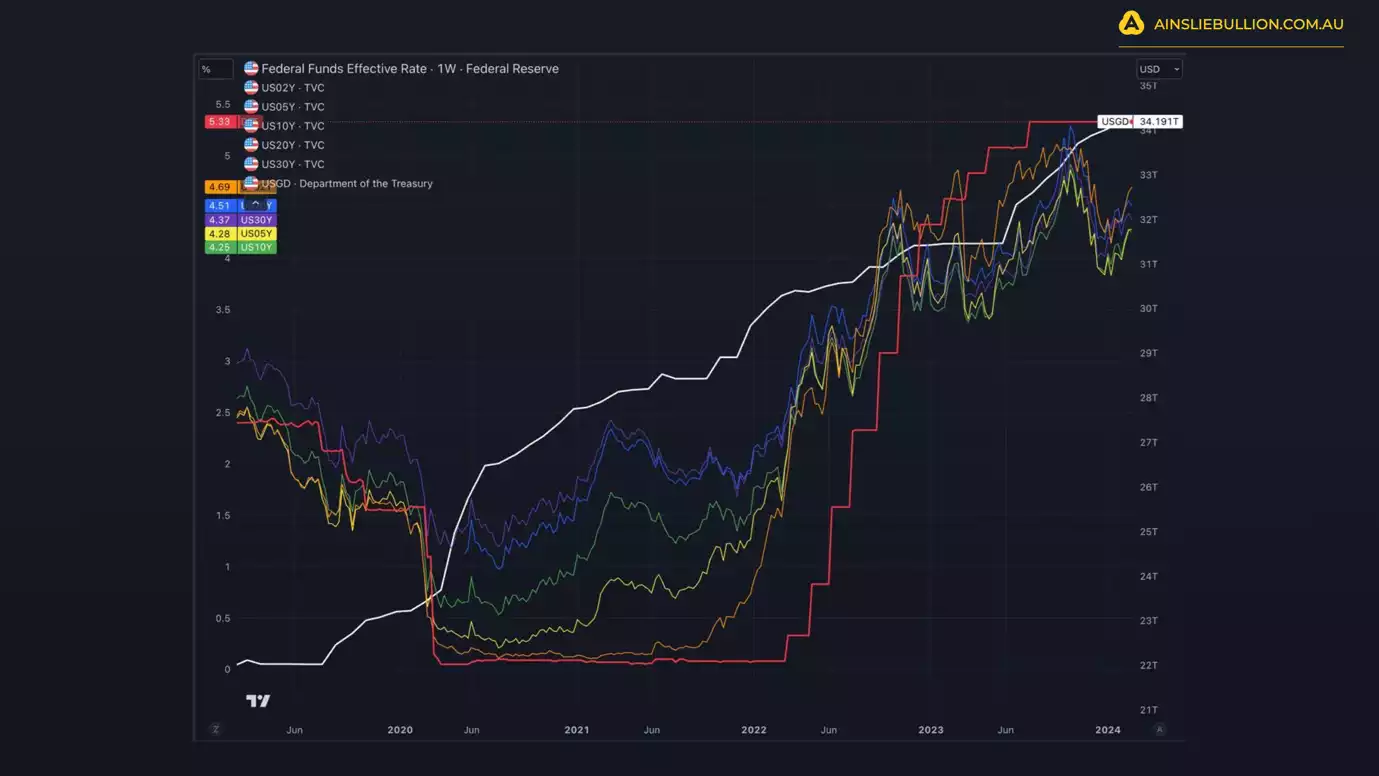
Where are we currently in the Global Liquidity Cycle?
Global Liquidity leads the movement of World financial assets, so this is the indicator we look most closely at to determine where the opportunities are to take advantage of.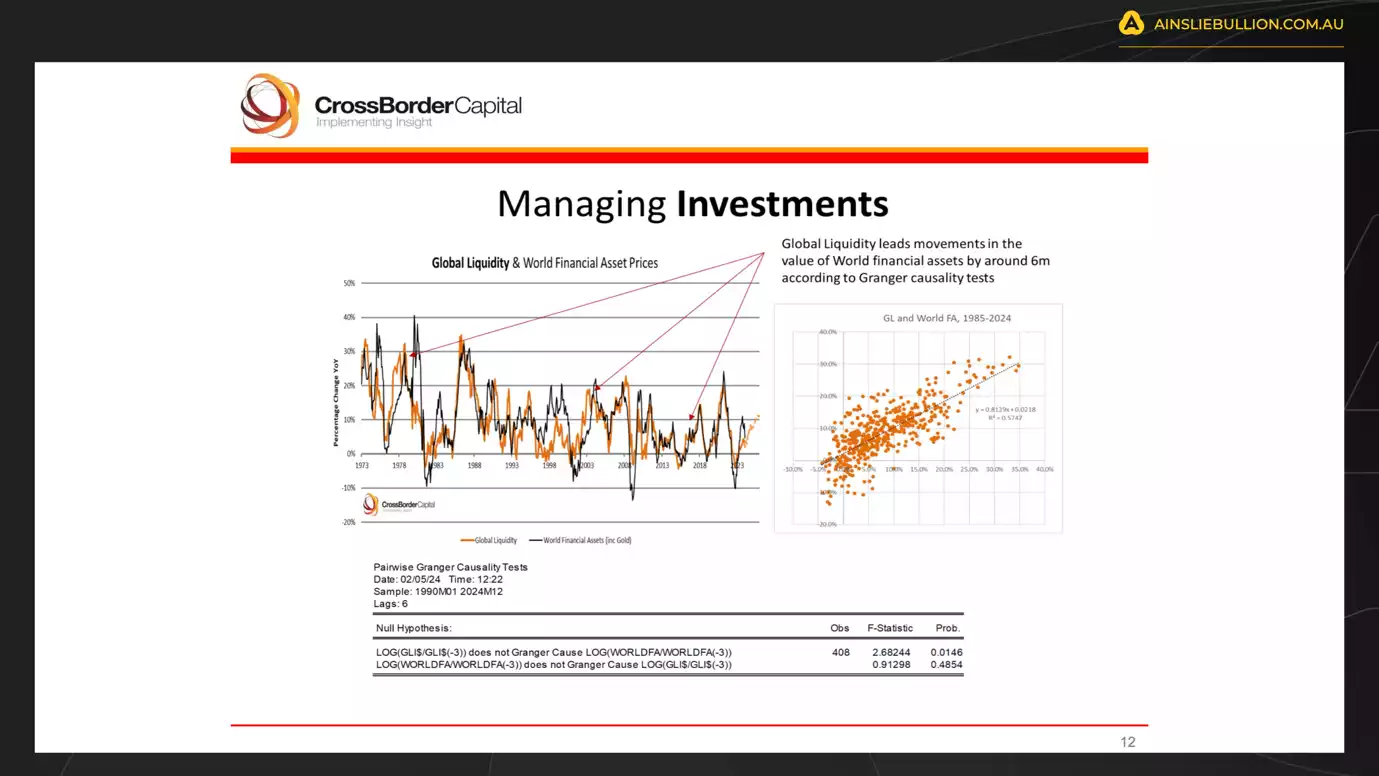
Global Liquidity is currently recovering from the cycle lows that occurred in October 2022.

Macro Assets for Macro Cycles
Understanding Consumer Price Inflation (CPI) is far less important than Asset Price Inflation in ensuring wealth isn’t eroded, and can actually grow, over the long term. A combination of Gold, Silver, and Bitcoin keep up with the growth in Global Liquidity over time, and the corresponding debasement of fiat currencies. As such we look to trade into each at the appropriate times to take optimum advantage of the cycles. When correctly timing and structuring the rotation, it is possible to significantly outperform ongoing monetary debasement.

The Gold cycle low was in September 2022 and the price appears to be rising consistently with an improving Global Liquidity picture ever since.

It is a similar story with Silver which also had a cycle low in September 2022.

As shown by the Gold Silver Ratio (GSR), even though Silver may be trending sideways currently, when the ratio falls it can happen very suddenly, and the move in Silver can be explosive. The GSR is currently very high by longer term historical standards and trending upwards, so the potential for another Silver “slingshot” move higher, as the GSR mean reverts, continues to increase.

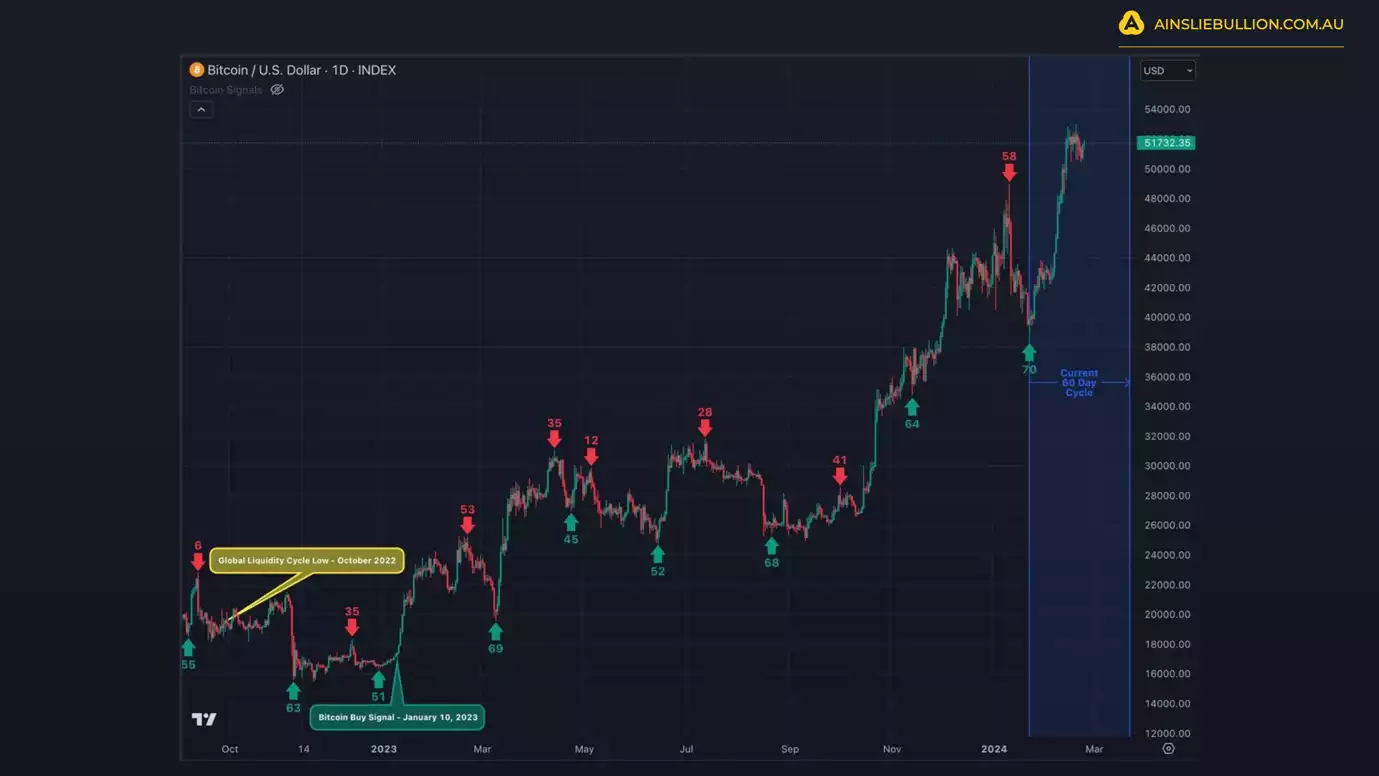
Bitcoin is the most directly correlated asset to Global Liquidity. Trading Bitcoin can be thought of as trading the Global Liquidity Cycle, but with an adoption curve that leads to significantly higher highs and lows each cycle.

The Bitcoin cycle low was in November 2022, and since then the returns have been unmatched by any other major asset.

A Simple Trading Plan to take advantage of the cycles
Watch the video presentation to see full details of the specific Trading Plan we provide, that you can follow, which has returned 178.2% p.a. as at Monday’s recording.
Watch the full presentation with detailed explanations and discussion here:
Or on our YouTube Channel 👉 https://youtu.be/qSQnLsNlayI
Until next month when we return to reassess and identify what has changed, good luck in the market!
Chris Tipper
Chief Economist and Head of Business Strategy
The Ainslie Group
x.com/TipperAnalytics
Note: The monthly video presentation is recorded live with our expert panel to allow for an audience question and answer session at the end. If you are interested in being involved in the next live session (currently planned for the Monday the 25th of March at 6:30pm AEST/7:30pm AEDT) stay tuned for an invitation link that will be sent out closer to the date. Our objective is to make the updates as valuable and specific to what you want to understand as possible, so as always feel free to reach out with any feedback to help us craft this into what suits you best