Gold Demand Statistics for Q2 2024
News
|
Posted 06/08/2024
|
2899
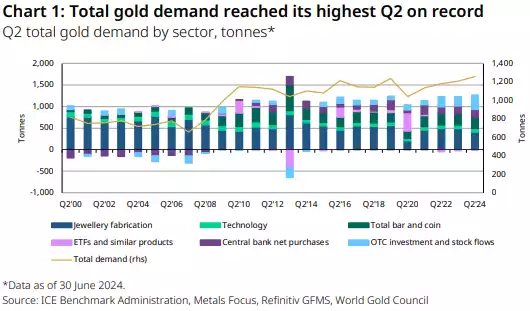
The World Gold Council has recently released the Q2 statistics for gold demand, which we’ll explore with some charts.
Gold demand excluding OTC investment in Q2 was down 6% year-on-year (y/y) as a sharp decline in jewellery consumption outweighed mild gains in all other sectors. Adding in OTC investment to total gold demand yields a 4% y/y increase – the highest Q2 since the World Gold Council has captured this data in 2000. The high record gold price – which averaged a record US$2,338/oz in Q2 – took a heavy toll on jewellery consumption. Central bank net gold buying remained strong overall and demand from the technology sector increased.
Jewellery
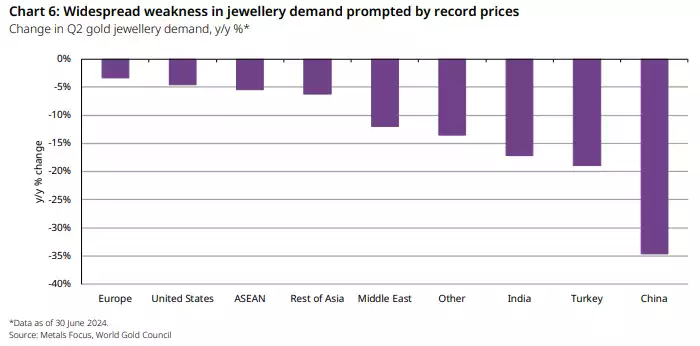
Record prices curbed gold jewellery volumes in markets worldwide, with few exceptions. The sharp decline, which is recorded at -19% y/y and headed by Chinese and Indian markets, due to the combination of the weaker domestic economic environment and record gold prices.
Investment
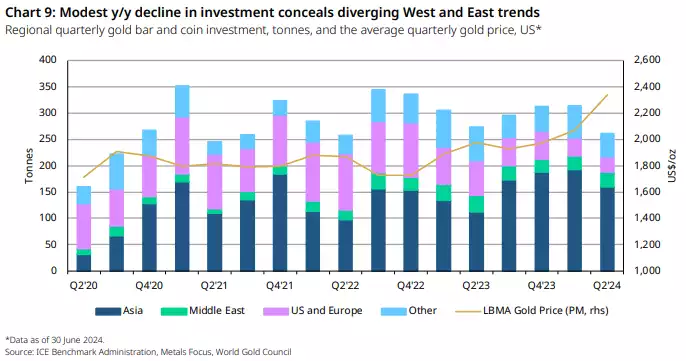
Global gold investment was resilient in Q2, although it conceals some variation across regions.
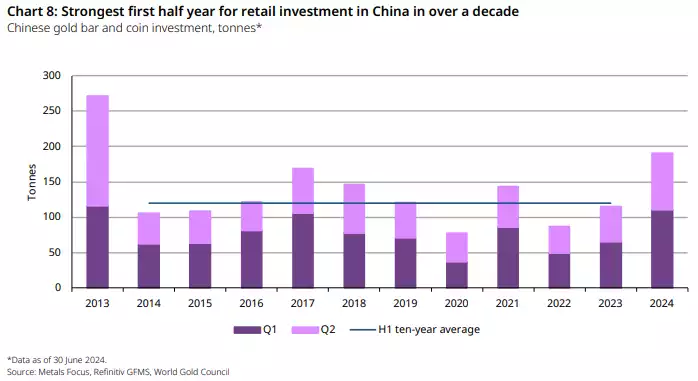
Overall, there was a 5% y/y decrease in bar and coin investment demand. Gold bar investment increased 12% y/y but there was a 38% fall in demand for coins which can be explained by the slump in net demand in Western markets (where gold coins are more popular) contrasting with strong investment demand in markets across Asia. Bar and coin demand in China had another strong quarter, surging 62% y/y. Despite a 28% q/q fall from a strong Q1, it was the best Q2 for bar and coin investment in China since 2013. Outflows from global gold ETFs eased during Q2: holdings declined by just 7t compared with 21t during Q2’23 and represented a marked slowdown from the 113t of outflows seen in Q1.
Central Banks
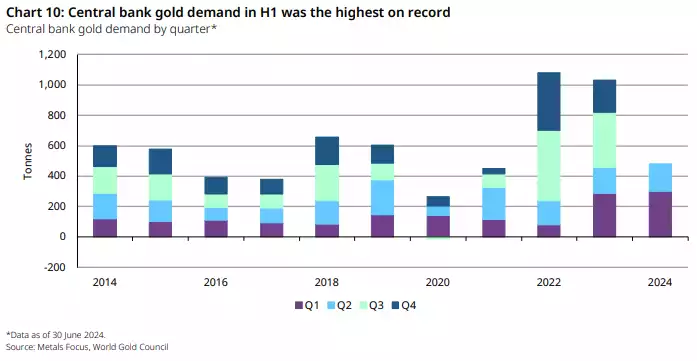
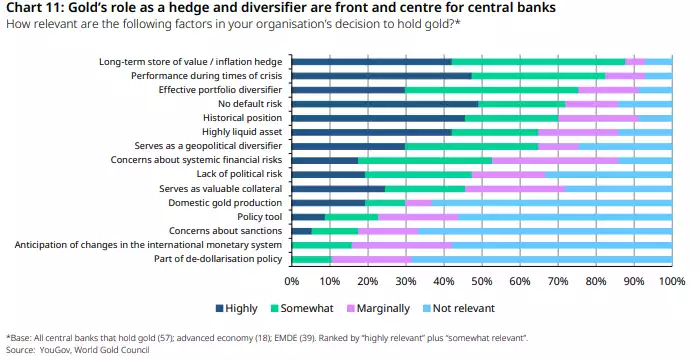
Central bank gold demand in Q2 was 39% lower than the very high Q1 but H1 demand was the highest on record. These figures are supported by the recent results of the 2024 Central Bank Gold Reserves Survey which we covered in more detail here.
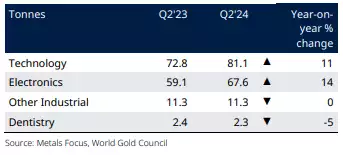
Technology
Gold used in industrial applications rose 11% y/y during the quarter, which was driven by the electronics sector, which experienced saw a 14% y/y increase in Q2. This has been spurred memory chip demand thanks to the rapid growth in demand for AI and high-performance computing. Gold used in other industrial applications was unchanged y/y at 11t, while dental demand continued its long-term decline, down 5% y/y to 2t.
