Central Banks Continue to Buy Gold up Big
News
|
Posted 11/12/2023
|
2881
After the truly extraordinary central bank buying spree in September, we last week learned October saw a continued strong month, with another 42 tonne added! From the World Gold Council:
“Central banks’ gold buying slowed in October but did nothing to alter the overall trend of robust buying that has captured the attention of gold investors. Reported global net purchases totalled 42 tonnes (t) during the month, 41% lower than September’s revised total of 72t, but still 23% above the January-September monthly average of 34t.
Even before October's net buying, we noted that 2023 was likely to be another colossal year of central bank buying.3 Having started Q4 positively, this year’s central bank demand looks set to climb even higher.”
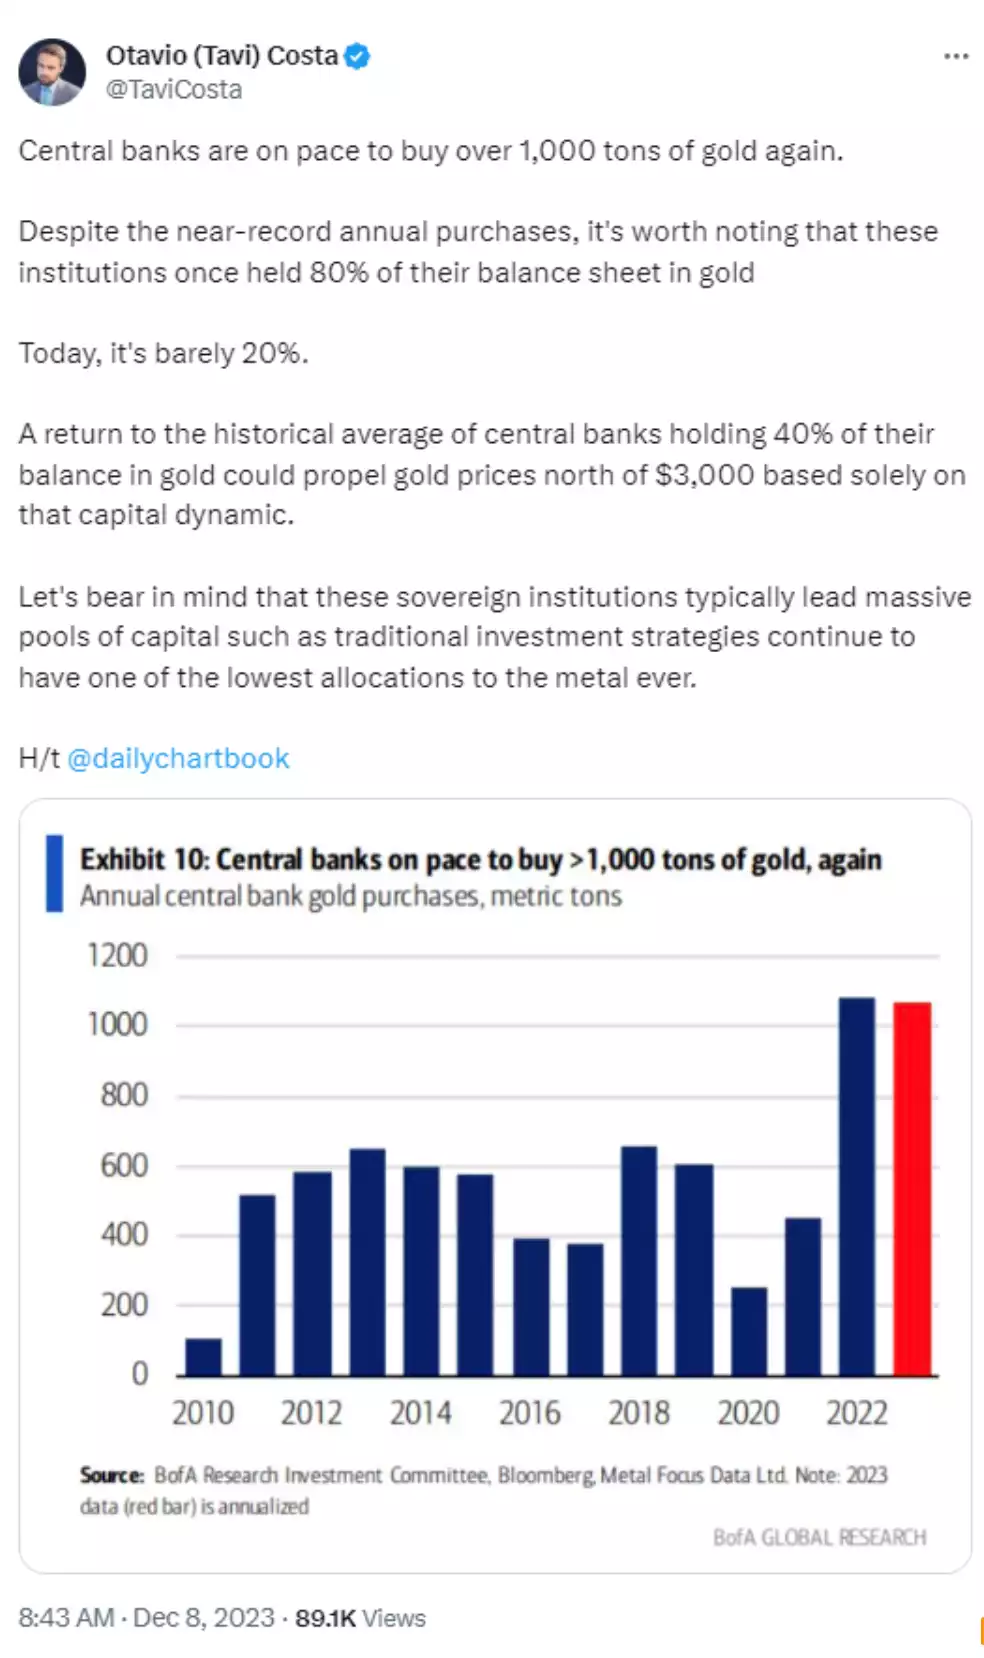
That said, as Crescat’s Tavi Costa points out below, it is still a fraction of what they have historically held:

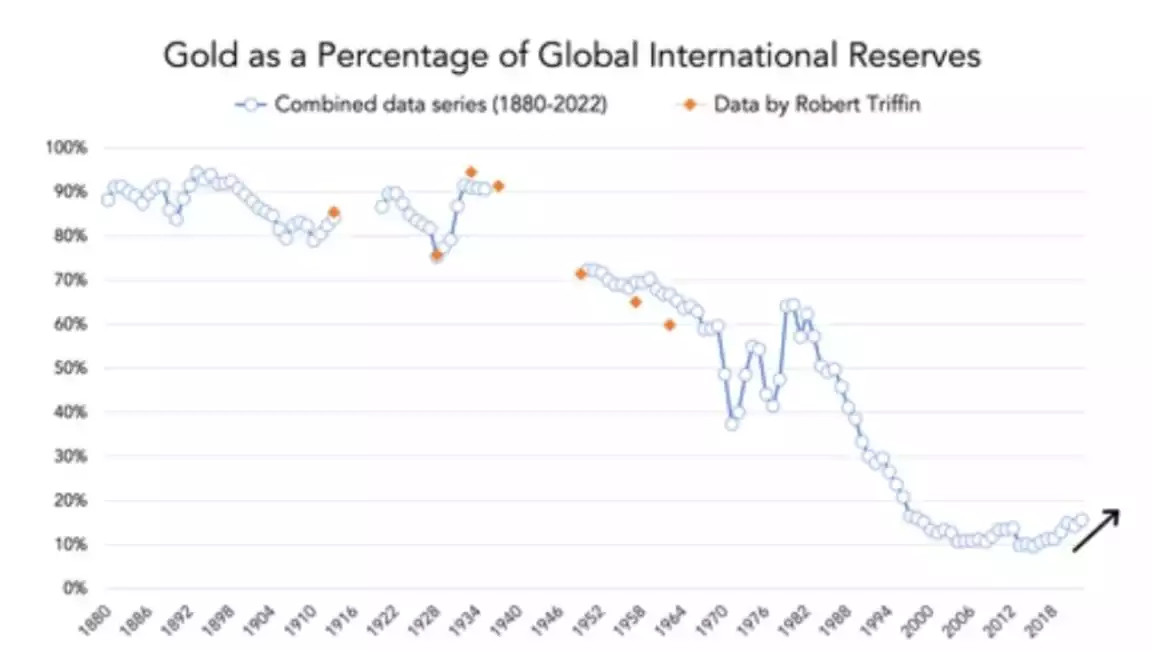
The chart below gives some insight into that history. Tellingly when the world left the gold standard in 1973, central banks started shedding the gold they ‘no longer needed’ to back their currency based on nothing but the promise of government (Fiat currency). This was ‘all fine’ until the GFC and the first real cracks of failure of a purely credit based system started to appear. Since the GFC, every year has seen a net increase in gold holdings, in stark contrast to nearly every year seeing a decline. The penny dropped…

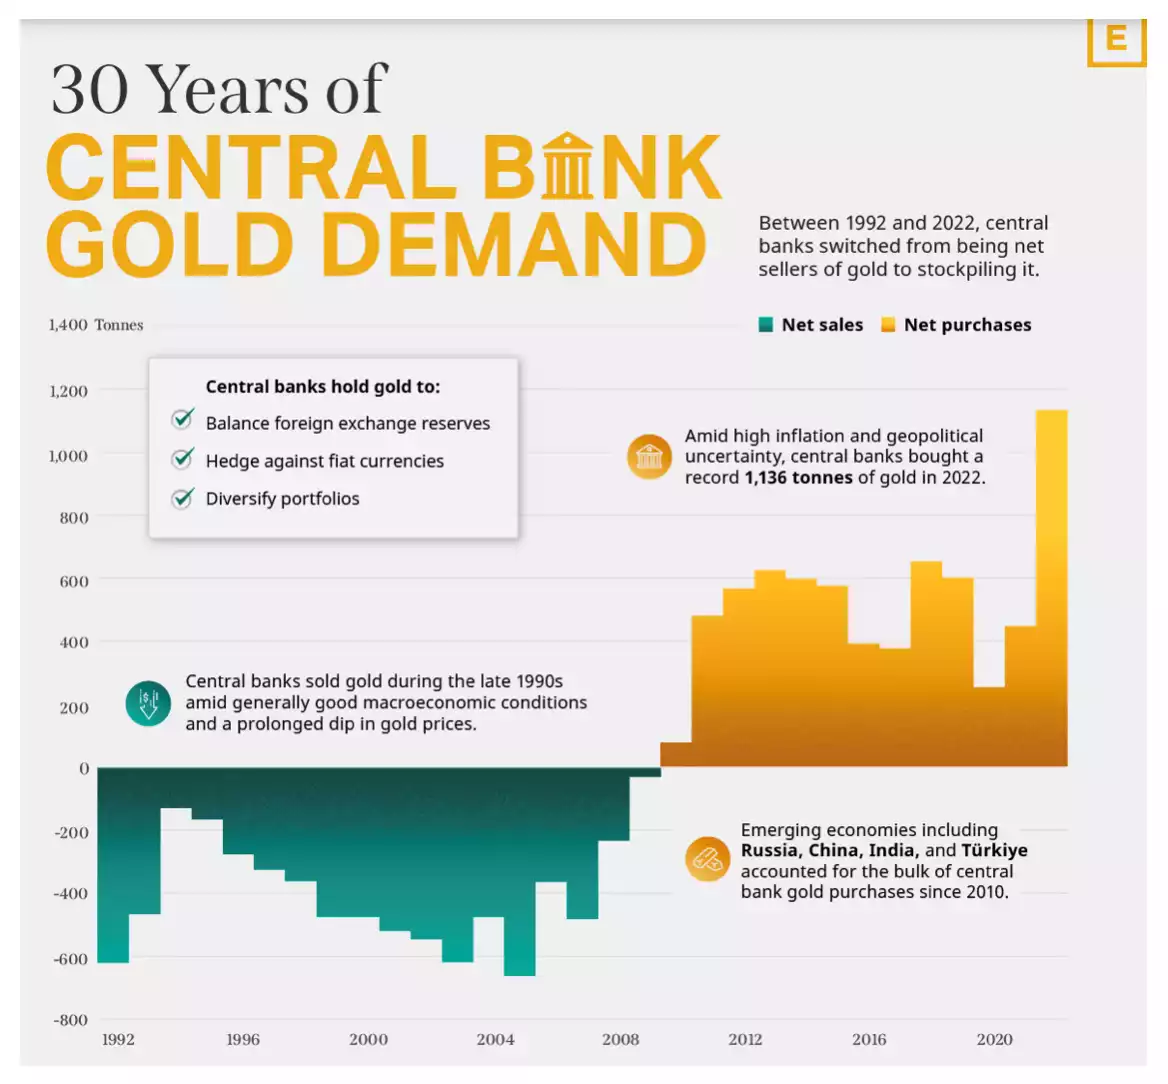
In pure weight terms it is even clearer per below from Visual Capitalist:

The old adage – ‘don’t do as they say, do as they do’ is one to keep in mind…