WGC - Gold Demand Trends Q3 2021
News
|
Posted 01/11/2021
|
9454
The World Gold Council’s quarterly demand trends report is out for Q3 and as usual we summarise for you.
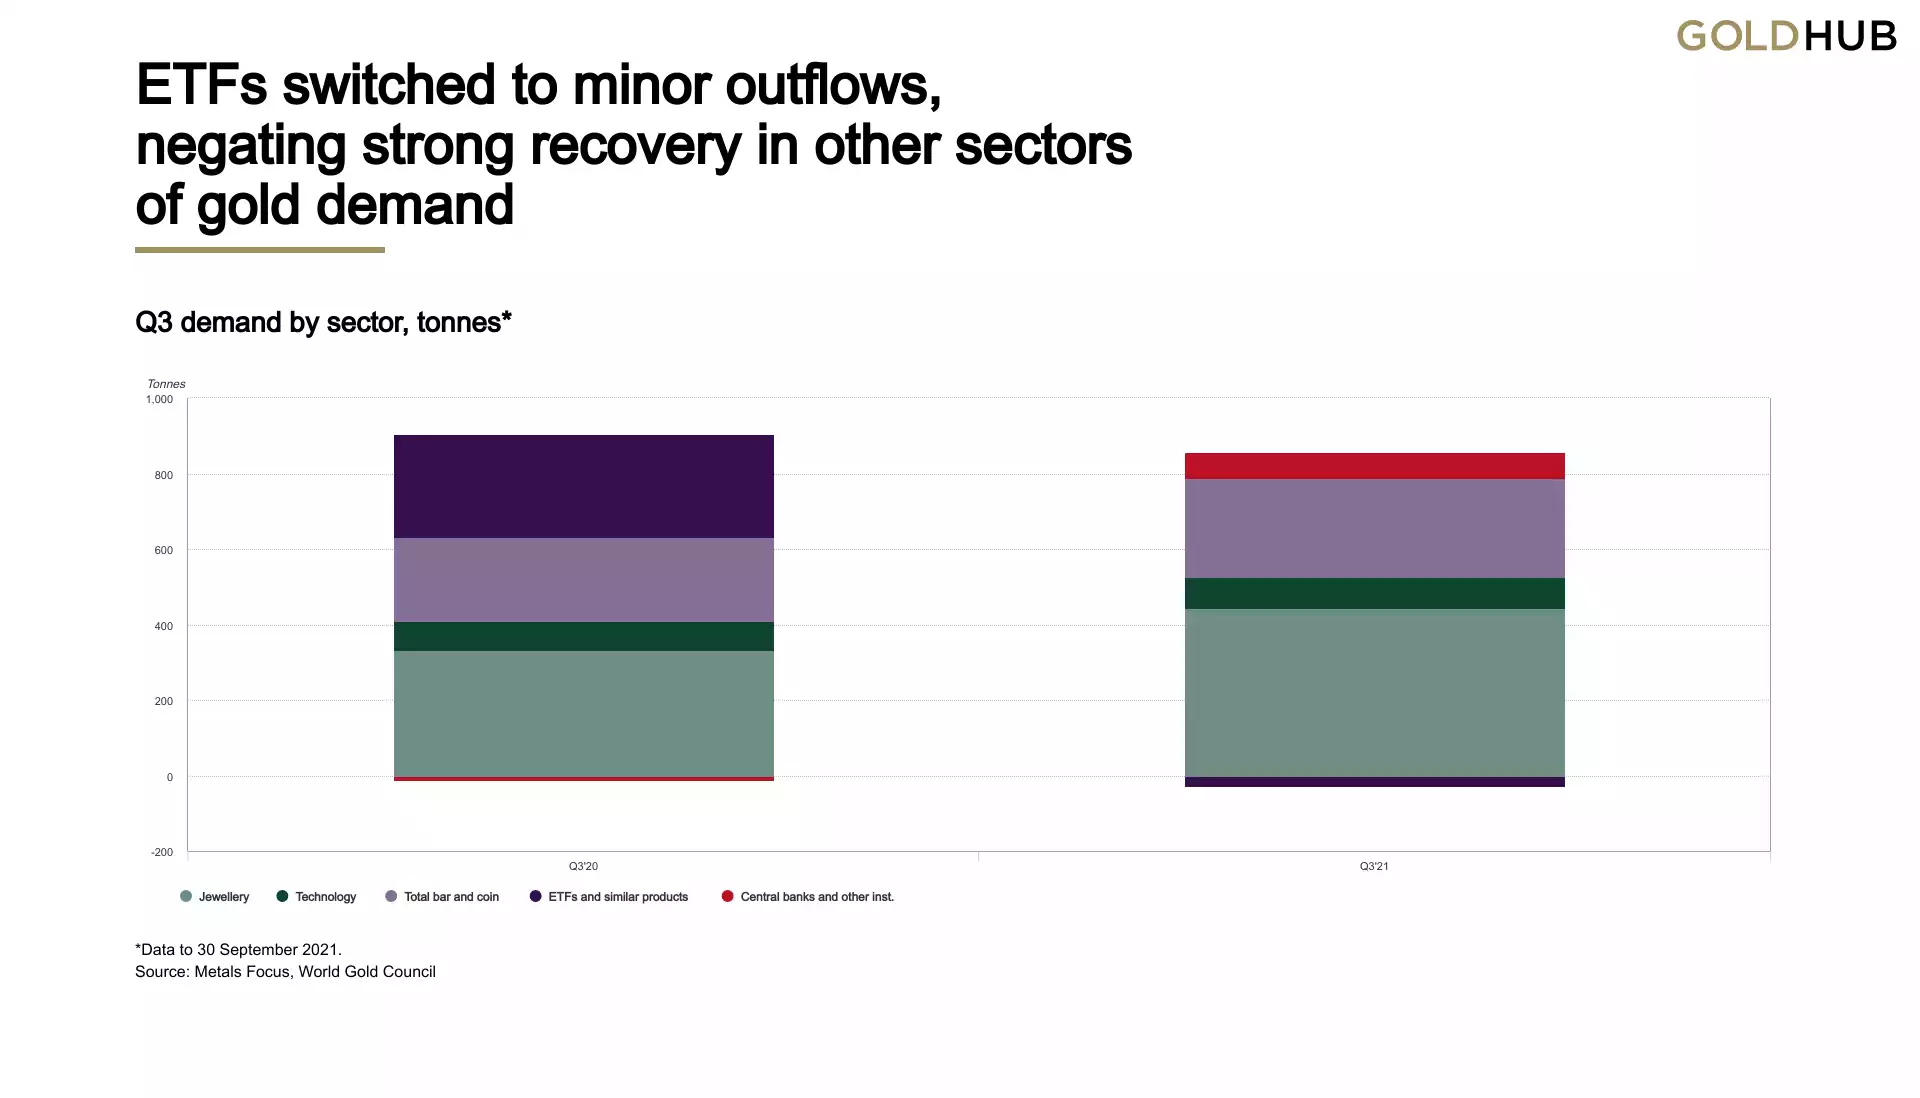
Q3 demand (excluding OTC) fell 7% y-o-y as the turnaround in gold ETFs – from substantial inflows to modest outflows – outweighed healthy recovery in other areas of demand.
ETFs
Small outflows from global gold ETFs (-27t) had a disproportionate impact on the y-o-y change in gold demand, given the hefty Q3’20 inflows of 274t. Outflows were concentrated in North America, while funds listed in other regions saw growth in holdings.
Investment Bars & Coins
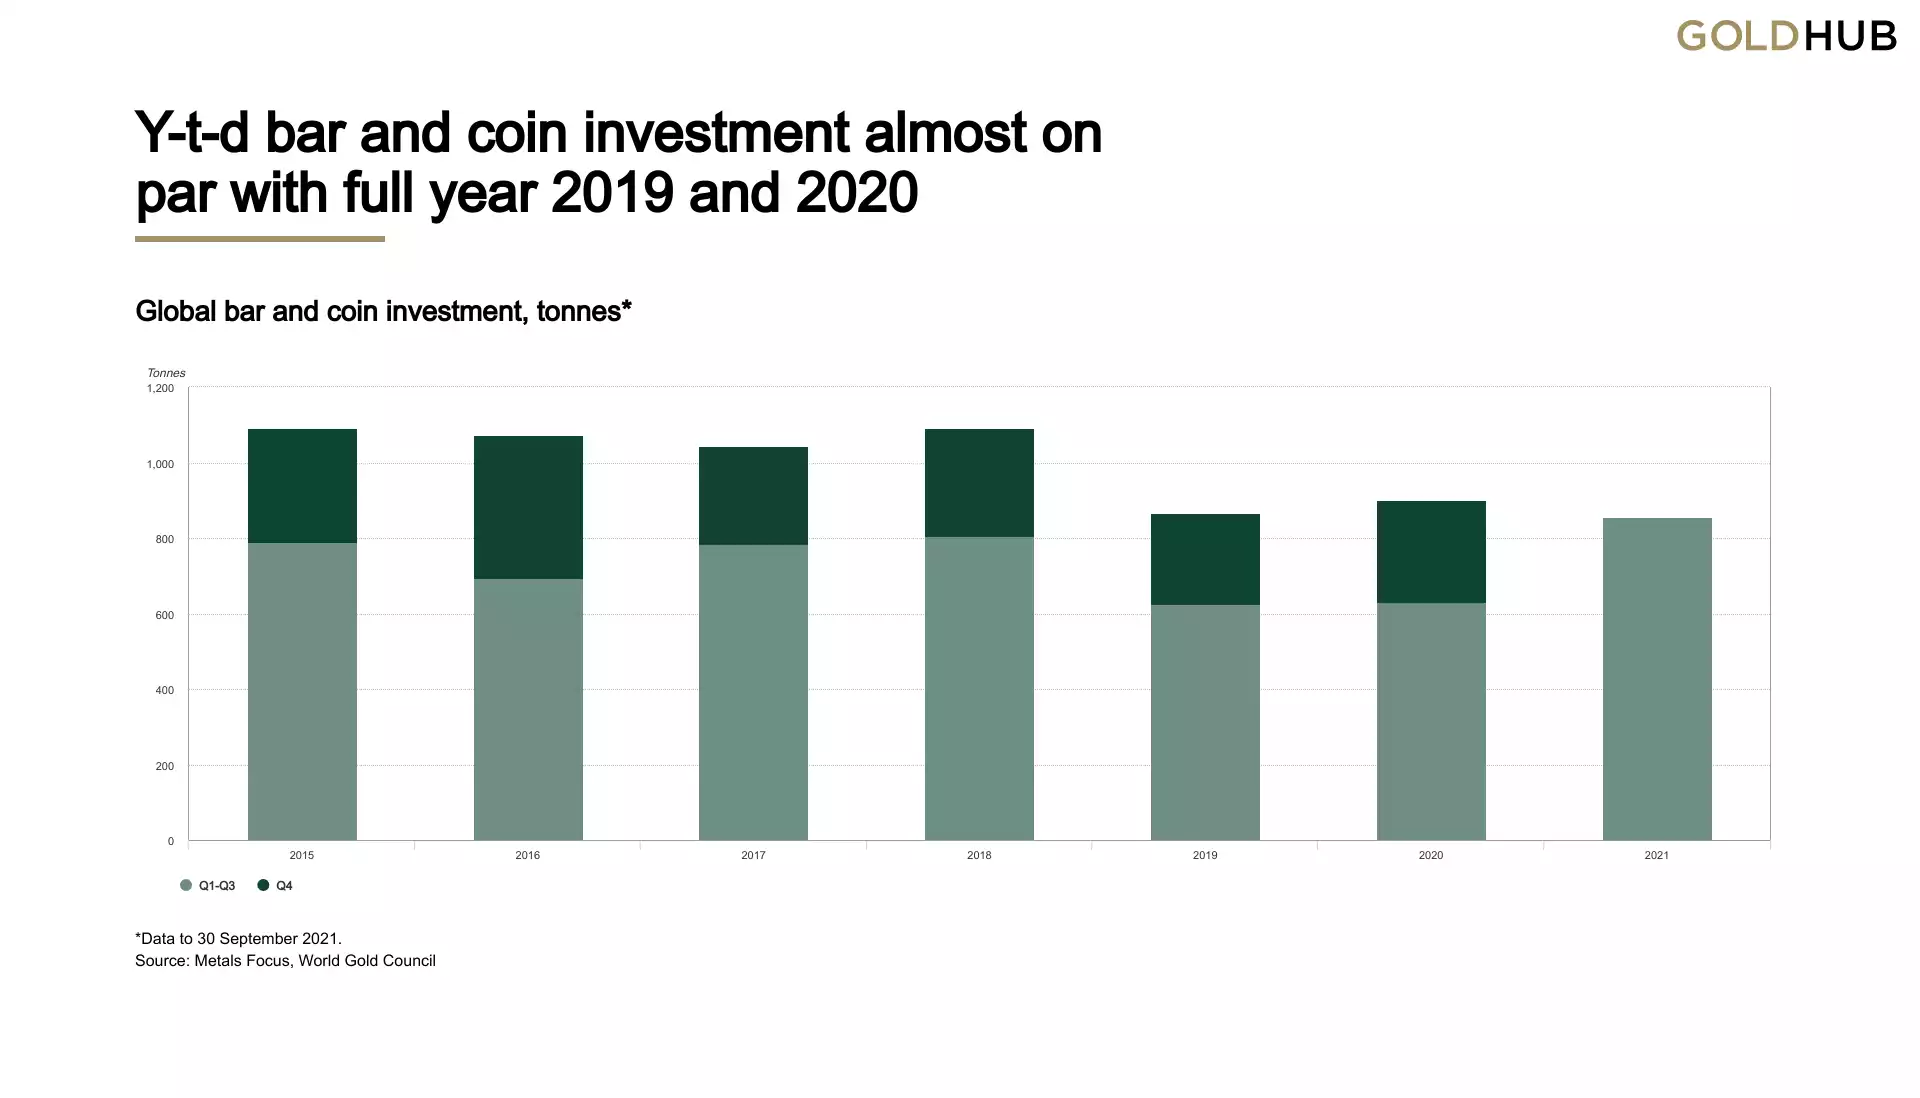
Global bar and coin demand in Q3 reached 262t, an 18% y-o-y increase. Growth was driven by a 56% increase in global bar investment (to 178t). This was countered by a 29% decline in demand for official coins to 59t, almost entirely due to a sharp reduction in Turkey’s coin purchases from last year’s record high.
The y-t-d total of 857t is the highest since 2013 – a time when demand rocketed, especially in Asian markets, as investors made the most of a sharp price drop to build holdings.
Strong Q3 growth was underpinned by a range of factors, including ongoing emergence from COVID restrictions in many countries, continued fears over rising inflation and the price dip in August which encouraged many investors to buy (particularly in Asia). Thailand had an outsized impact on the y-o-y comparison due to the swing in that market from strong net sales in Q3’20 (-45t) to modest net buying (7t) in the recent quarter.
Central Banks
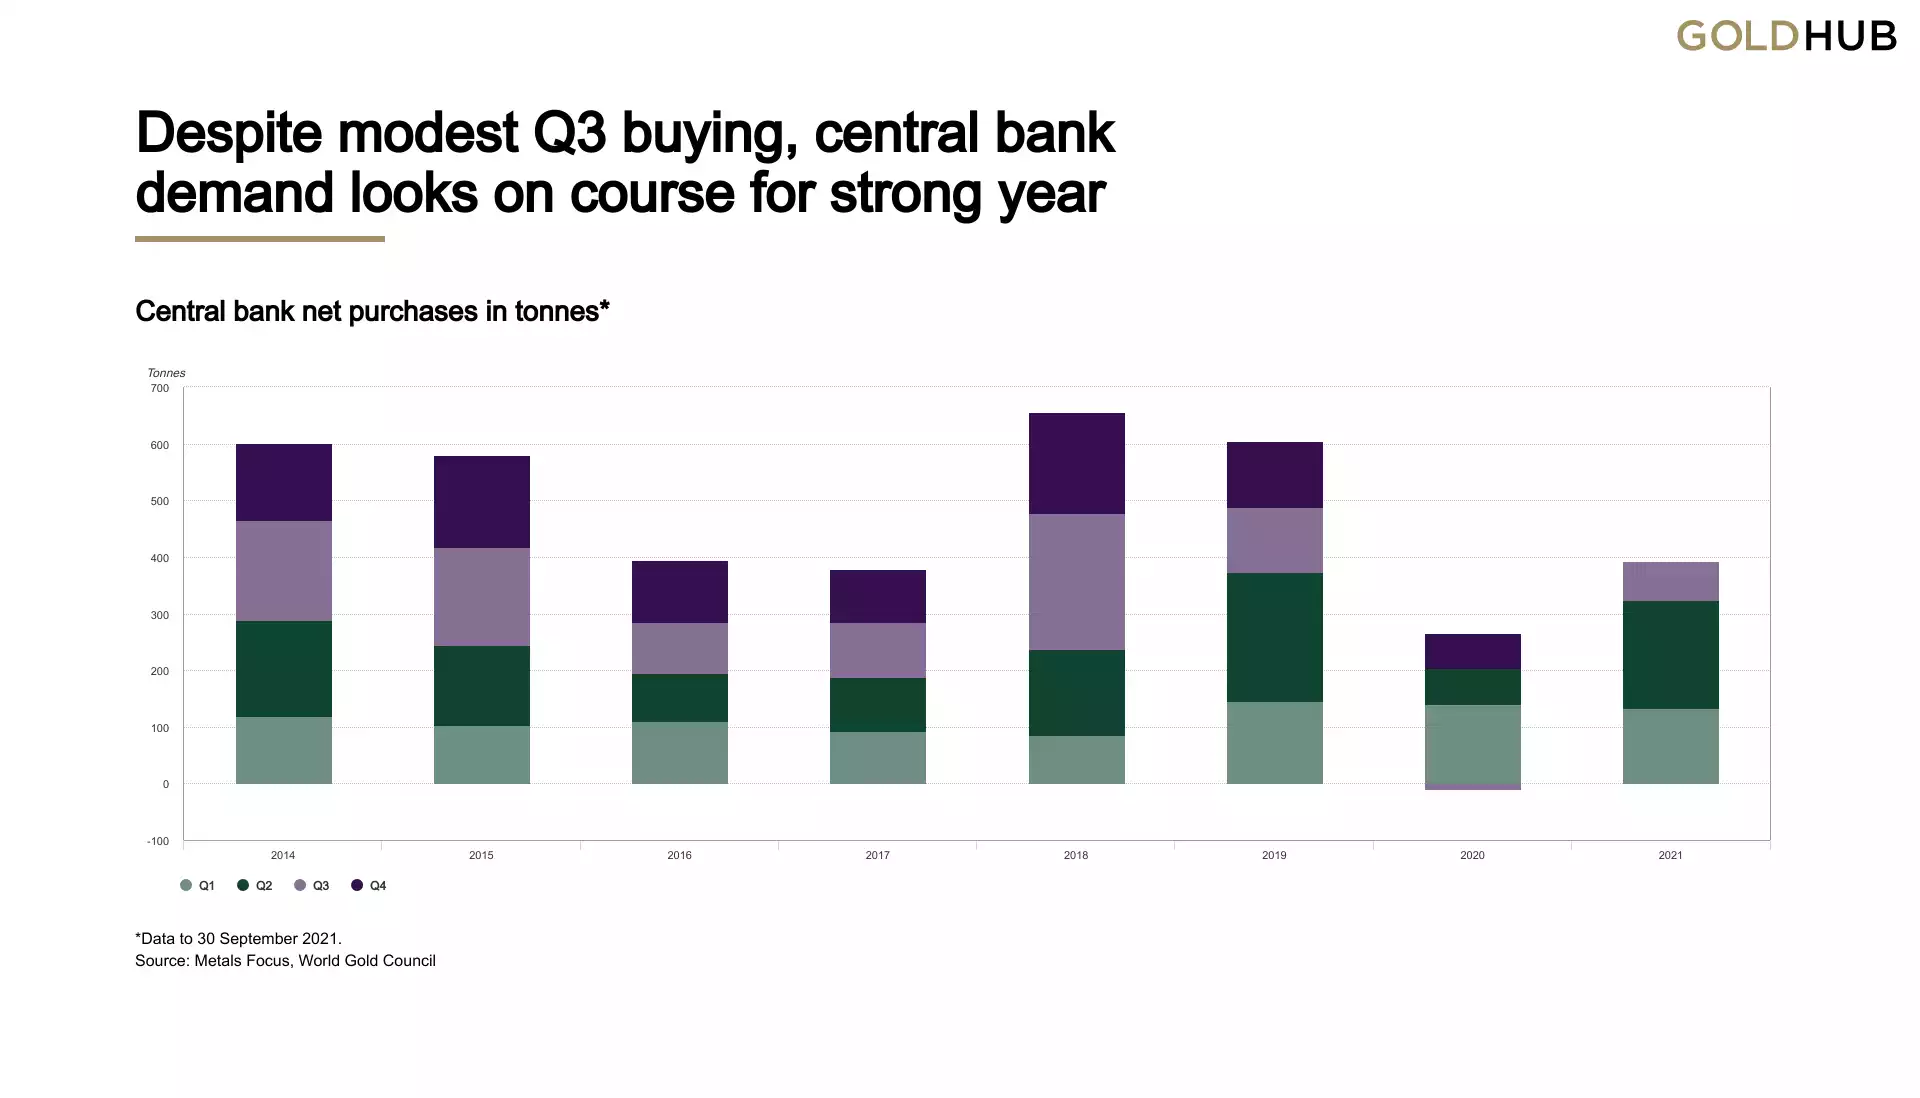
Central banks continued to buy gold. Annual demand could come in above 450t – significantly higher than 2020 and in line with the five-year average. Central bank gold buying in Q3 was modest by recent standards. Net purchases slowed to 69t from 191t in Q2. This contrasts with Q3’20, which was the first quarter of net central banks selling since 2011. Y-t-d buying had reached 393t by the end of Q3, more than double over the comparable period in 2020.
Jewellery
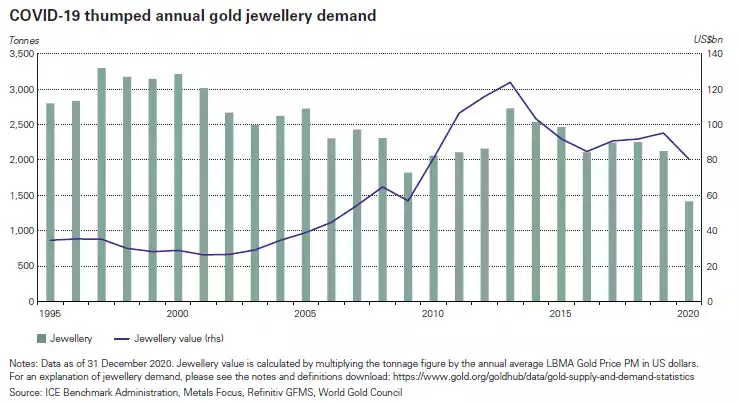
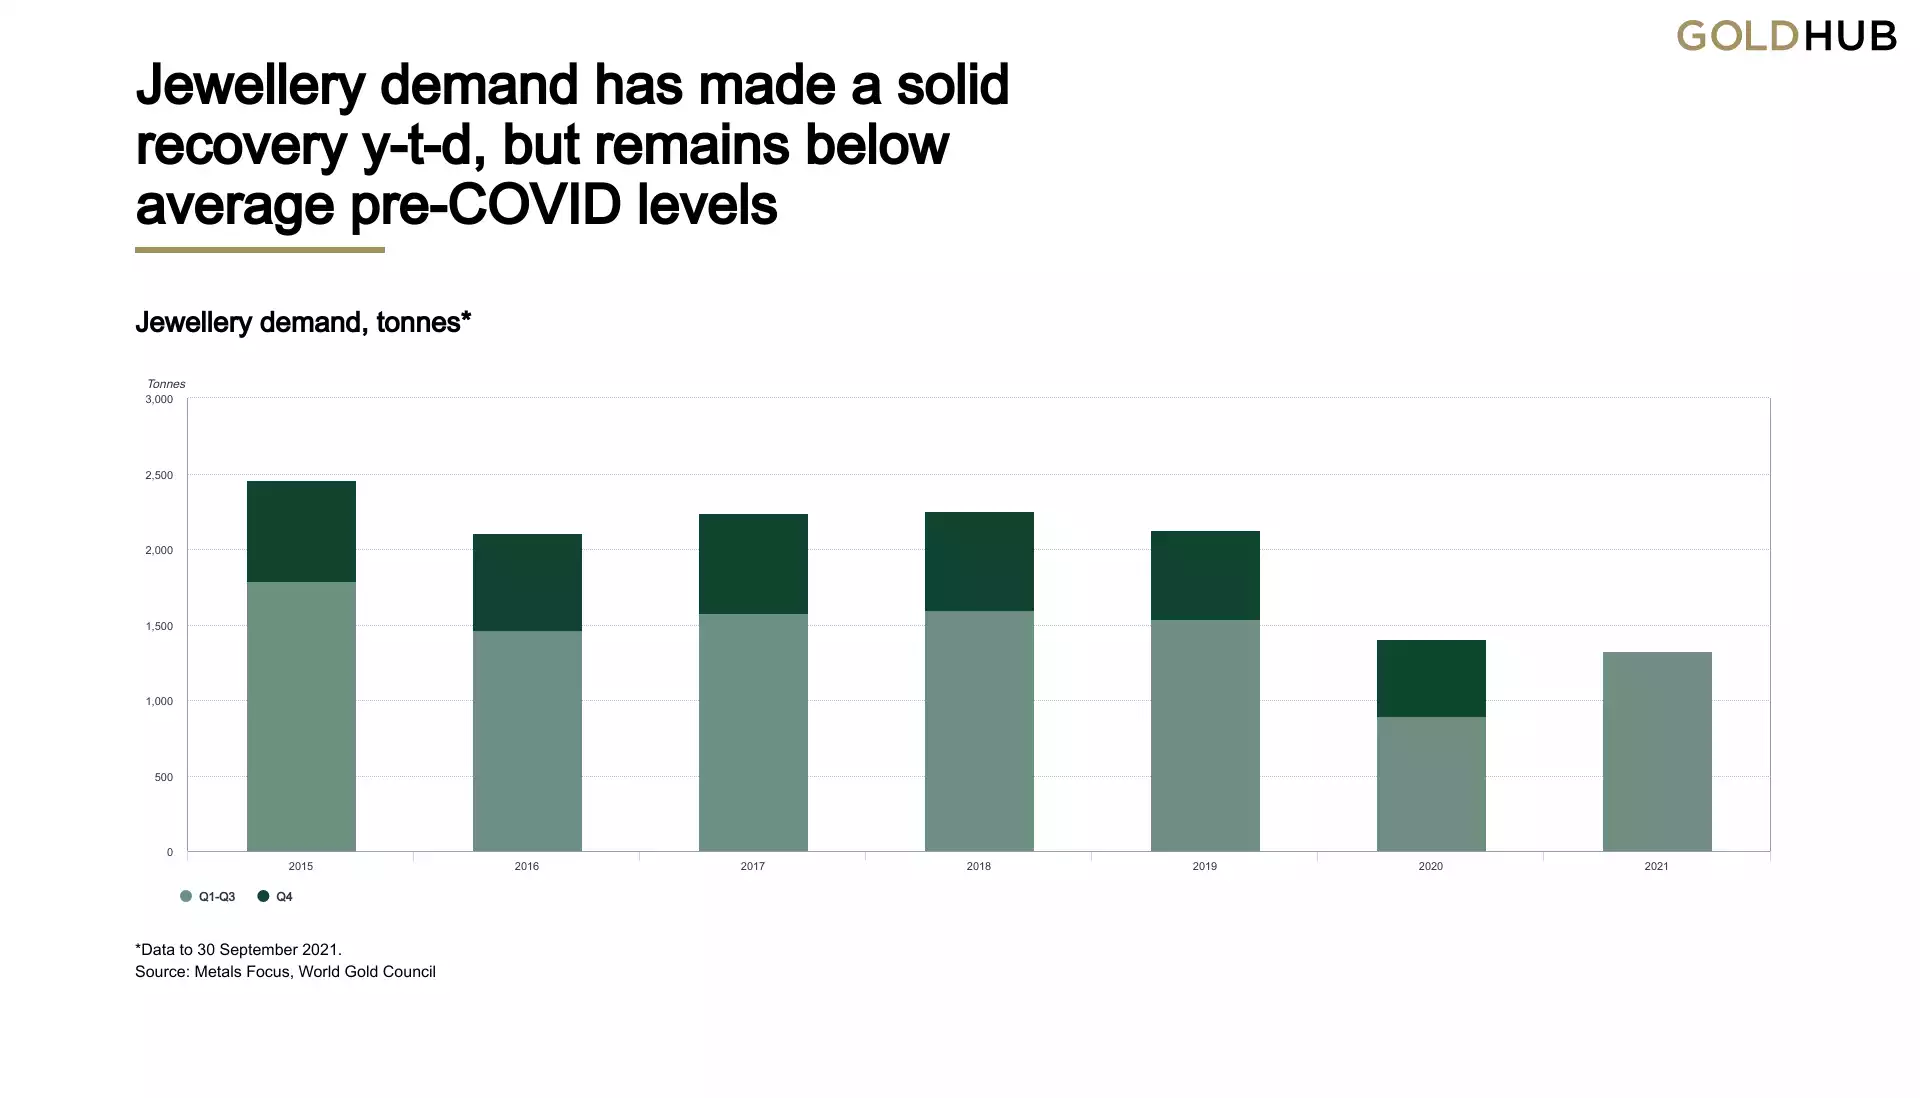
Jewellery demand rebounded 33% y-o-y to 443t. Consumers drew strength from the ongoing global recovery, a trend we expect to continue. Y-t-d, global jewellery demand is almost 50% higher than the same period in 2020.
The US dollar value of jewellery demand grew 25% y-o-y to US$25.5bn. The lower average quarterly gold price offset the 33% increase in demand volumes. Nonetheless, this was the highest value for jewellery demand for a third quarter in eight years.
Technology
Gold demand in technology rose by 9% y-o-y to 84t in Q3. The dominant electronics sector saw equivalent growth, up 9% y-o-y to 69t, which marks a return to quarterly demand volumes that were typical before the pandemic. Other industrial demand continued its strong recovery, growing 10% y-o-y to 12t, while dental demand resumed its long-term decline, falling by 8% to 3t.
Supply
Gold supply contracted y-o-y. Q3 mine production increased by 4% y-o-y as there were fewer COVID-19 production interruptions compared to last year. But underlying production growth was demonstrated by the 3% increase compared to 2019 pre-pandemic levels. A lower gold price during the quarter and evidence of depleted near-market supply of old jewellery saw recycled gold supply 22% lower y-o-y. Recycled supply has consistently fallen y-o-y in each quarter of 2021 so far.