The Secret Behind the S&P500 and What it means for gold
News
|
Posted 23/05/2023
|
10751
Yesterday we wrote to the relative performance of gold and the world’s biggest share index, the S&P500 after each previous comparable US Treasury Yield Inversion. Today we look behind that broad share index to reveal a far deeper story than even those amazing charts we shared yesterday.
Jim Bianco of Bianco Research recently tweeted some very interesting charts. He looks under the hood of the S&P500, an index covering the 500 top companies in the US. 500 companies implies a very broad mix of industries, services, etc no? To be sure we have written previously of the huge component and weighting of the S&P500 (SPX) that is made up of the tech giants. However since the first recent bank failure in the US, Silvergate Bank on 8 March, Bianco has observed a structural shift in the index. Simplistically, and lets face it bemusingly, the SPX is UP 5.4% since that canary in the coal mine?? (regular readers will know why, but read on)
First if you strip out the market cap weighting and look at all 500 companies on an equal weight basis the divergence is quite profound. On an equal weight basis the index would be DOWN 2.2%...
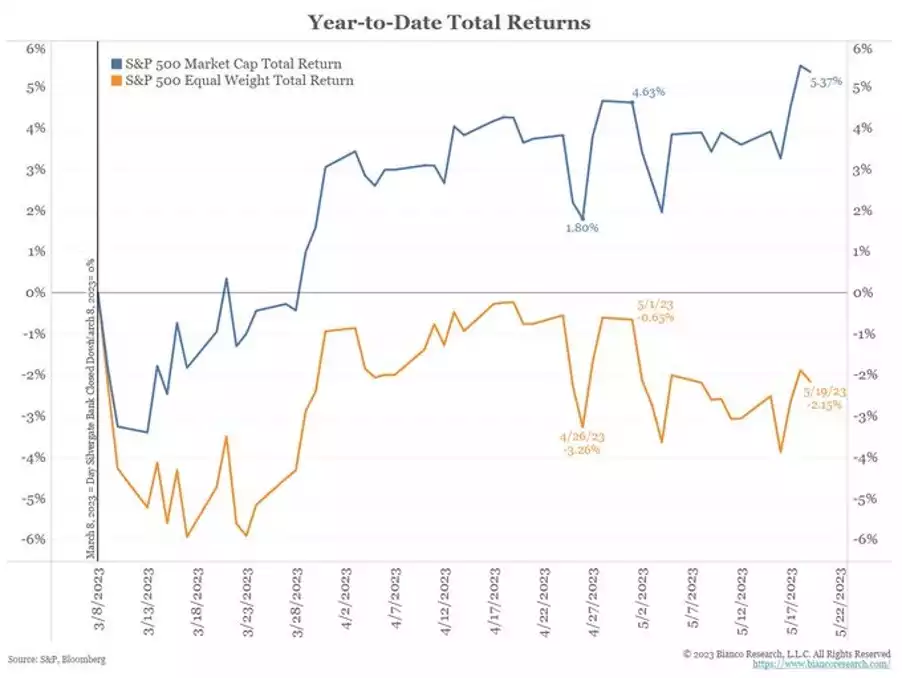
That is a 7.5% difference or ‘spread’ which has only ever happened 3 times previously:
- COVID collapse of 2020
- GFC collapse of 2008
- Dot.com mania in late 1999.
We all know what happened next there…
You can see where this is going, but next he compares the SPX with the NASDAQ (tech shares) and Russell 2000 (small cap shares) since 8 March as well:
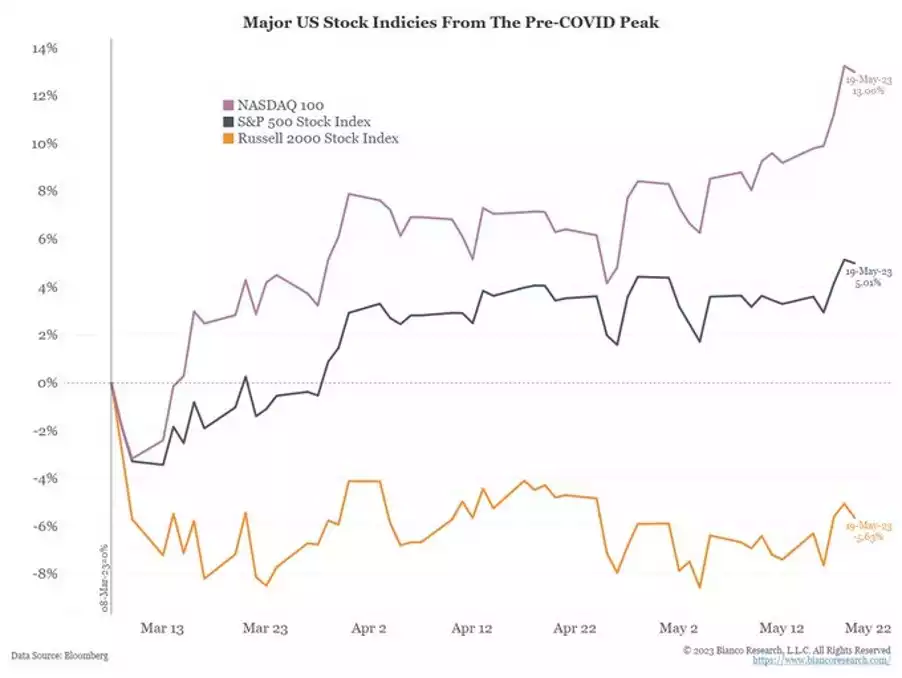
You can very clearly see who’s doing all the heavy lifting but let’s make it even clearer by stripping out the so called FAANG+M N T (Facebook/Meta, Apple, Amazon, Netflix, Google, Microsoft, Nividia, and Tesla) super tech shares.
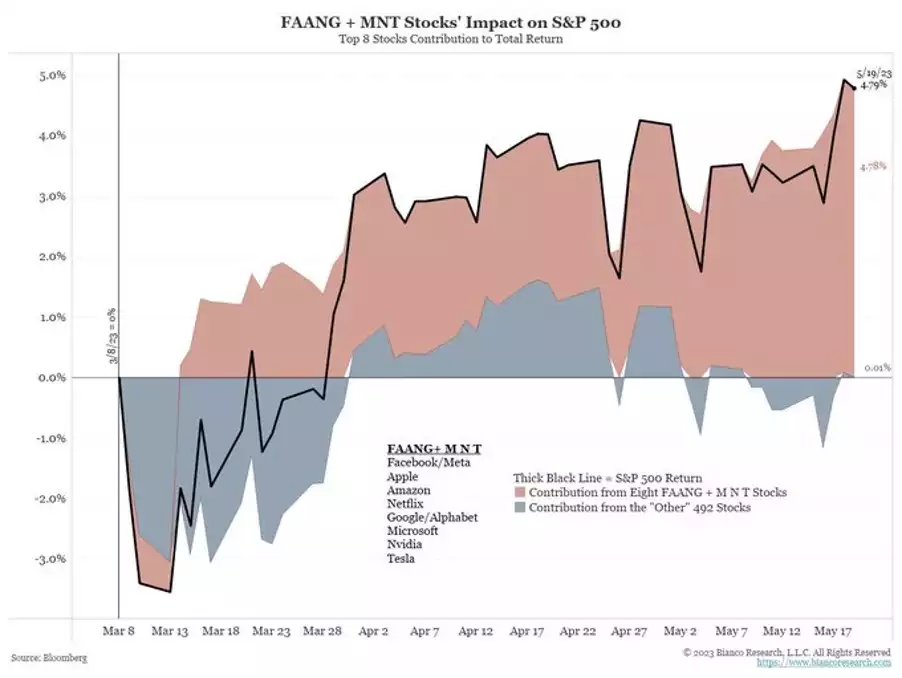
As Bianco says:
“The ‘other 492’ have literally done nothing
I see 2 things.
- A small number of mega-cap Tech stocks are seeing an AI/ChatGPT mania (see 1999).
- The rest of the market is struggling. Why? History shows that when banks are in trouble, so is the economy. Bank stocks, a proxy for their health, are still in trouble.
If you believe in AI, buy the 8 mega-tech and the other AI plays.
Beyond that, the rest of the stock mkt stopped cold when the banks started failing (Mar 8).
The economy needs healthy banks, AI stocks do not. The rest of the market trades as if the banks are not healthy.”
There are a few things we can observe from this.
Bianco is clearly in the ‘big correction coming’ camp. We’ve shown repeatedly how gold outperforms in sharemarket crashes and recessions.
Banks are not healthy because of the inversion of the yield curve we discussed yesterday and in Friday’s HOW ‘GUARANTEED’ IS YOUR BANK DEPOSIT?. Gold has proven to drastically outperform shares post each such yield curve inversion.
The only thing propping up this disparity not already being greater is the mega tech shares, per above. Why are they surging? As we wrote yesterday ITS ALL ABOUT LIQUIDITY. Whilst giving the illusion of tightening monetary policy through interest rates to ‘rein in inflation’, the US Fed has indeed been pumping money in at the same time to keep the ship from going down under all this debt and bleeding banks. They have unwound nearly all their QT in the matter of a couple of months. Again, one of the closest correlations with increased liquidity is… the gold price! But this easy money also finds its way into growth shares like tech that care less about banks and ‘fundamentals’. The Bitcoin price too is probably the closest correlated to liquidity and enjoys the same adoption impetus as tech shares but with the same higher risk profile for each.
The old saying ‘follow the money’ is only partly correct. What may be more relevant today is ‘follow the newly created currency into the age old money… gold’. If someone is creating something out of thin air and you can convert it into real money with no counterparty risk.. well… Look at the chart of gold since 8 March too….