Silver Mining Yields
News
|
Posted 22/04/2014
|
6253
Silver Mining Yields
Last week we looked at gold mining costs and production ounces compared to processed ore. Now let’s look at Silver.
The top primary silver miner’s average yield declined 41% from 13 oz/t in 2005, to 7.6 oz/t in 2013. The top 6 mines and companies included in the chart above are BHP Billiton’s Cannington mine, Fresnillo, Pan American Silver, Polymetal’s Dukat & Lunnoye mines, Hochschild and Hecla.
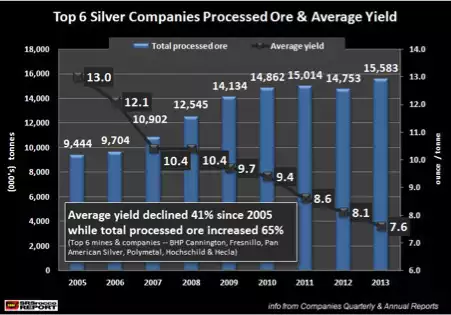
Even though the average silver yield only declined 41% since 2005, the amount of processed ore increased 65% from 9.4 million tonnes in 2005 to 15.5 million tonnes in 2013. Not only has the amount of processed tonnage increased to produce less silver in 2013 compared to 2005… the costs of energy, labour and materials have doubled or tripled during the same time period.
Falling ore grades and yields are impacting all mining companies. It will become more expensive to produce silver in the future as ore grades continue to decline while costs of energy, materials and labour increase.
Analysts who believe the price of silver is heading lower in the future… the falling yields and increased costs will prove otherwise.