Gold Demand Trends Full Year 2022 – World Gold Council
News
|
Posted 01/02/2023
|
18907
Each quarter we present the World Gold Council’s Gold Demand Trends reports but this time it includes their whole of 2022 data. In short the headline says it all with “2022: strongest year for gold demand in over a decade”. So let’s see what they had to say about the year of 2022 and our take on what this all means.
“Colossal central bank purchases, aided by vigorous retail investor buying and slower ETF outflows, lifted annual demand to an 11-year high
Annual gold demand (excluding OTC) jumped 18% to 4,741t, almost on a par with 2011 – a time of exceptional investment demand. The strong full-year total was aided by record Q4 demand of 1,337t.”

As we covered in our own end of 2022 Wrap gold actually held fairly steady over the year, albeit against heavy falls in nearly every other asset class. Interestingly though, its consistency over the year actually saw it post a record annual year high average spot price of US$1800/oz. Of course so far in 2023 Mr Consistency has rallied nicely to US$1930 at the time of writing already. So lets see what they had to say per sector, starting with the one closest to our heart, investment demand:
Investment
- Global bar and coin demand improved on the already healthy 2021 total, gaining 2% to 1,217t
- Despite Q1 gains, gold ETF holdings fell by 110t in 2022 but this was significantly lower than the 189t of net selling seen in 20211
- Total annual investment increased 10% to 1,107t.

“2022 was a textbook example of how gold’s diverse sources of demand and supply can counterbalance one another, providing gold with its uniquely stable performance as an investment asset.
ETF investment was weak, albeit improved from 2021; in contrast, retail bar and coin buying was strong, driving gold to a marginal gain in 2022. The anaemic sentiment in ETFs was also reflected in managed money net positioning on COMEX, which oscillated between net long and net short in H2 2022.
As well as underlying support from geopolitics, gold investment was impacted by a combination of multi-decade high inflation, especially in Western markets, and the resultant aggressive rate hikes by the Fed and other central banks. Bar and coin investors focused on the former and sought the safety of gold as a hedge against inflation. In contrast gold ETF investors reduced their holdings, especially in the second half, focusing on gold’s rising opportunity cost as central banks across the globe imposed hefty rate hikes and the US dollar surged.”

The breakdown of the physical gold investment demand is very interesting and hasn’t been discussed that much. Whilst everyone was looking at China’s central bank buy up their private consumption was hit by COVID lockdowns:
“Q4 bar and coin demand in China fell 20% y-o-y to 61t, taking the full year total down 24% to 218t, due mainly to COVID-related restrictions throughout the year.
Annual retail investment was 18% below its 10-year average of 269t and was more in line with the 199t of demand in 2020 – a year also affected by lockdowns.”
On the other hand we saw record demand from the west:
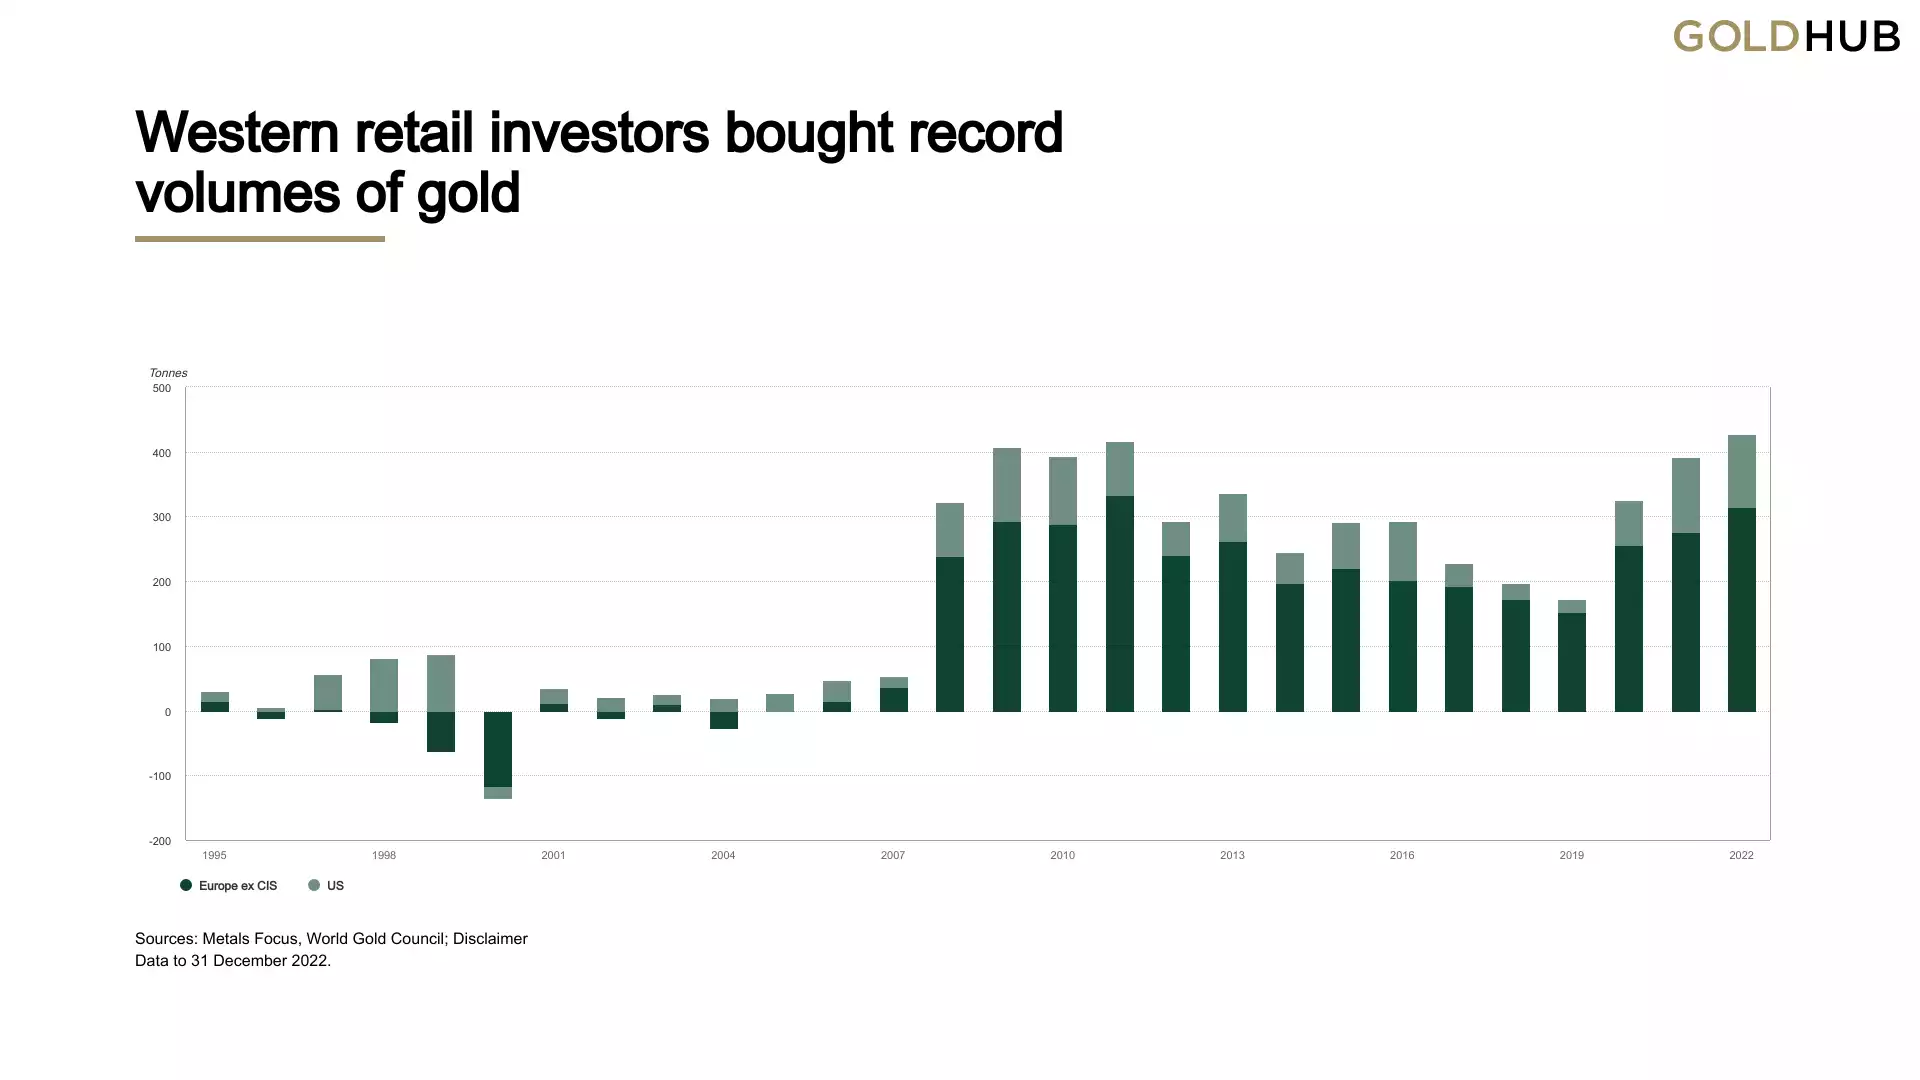
“Western investment demand for physical gold products reached an annual record in 2022. Combined US and European purchases of gold bars and coins hit 427t, exceeding the previous record of 416t in 2011.”
The following chart is a beautiful illustration of the realisation of the lessons from the GFC and the doubling down response of central banks debasing our monetary system. i.e. since 2008 more and more people are turning to real money as fiat ‘money’ is debased at a record pace and the implications of the inevitable outcome of history’s biggest credit bubble become abundantly clear to anyone paying attention…

WGC (through Metals Focus) now report on Australia and had this to say:
“Investor appetite for gold remains fairly strong on the back of concerns about global economic malaise, high inflation and the spectre of rising interest rates in an over-leveraged market. While retail investment demand remained lower than its impressive Q1 levels, it was robust at just over 4t. Overall 2022 retail investment demand of just under 20t was down 2% y-o-y.”
Central Banks
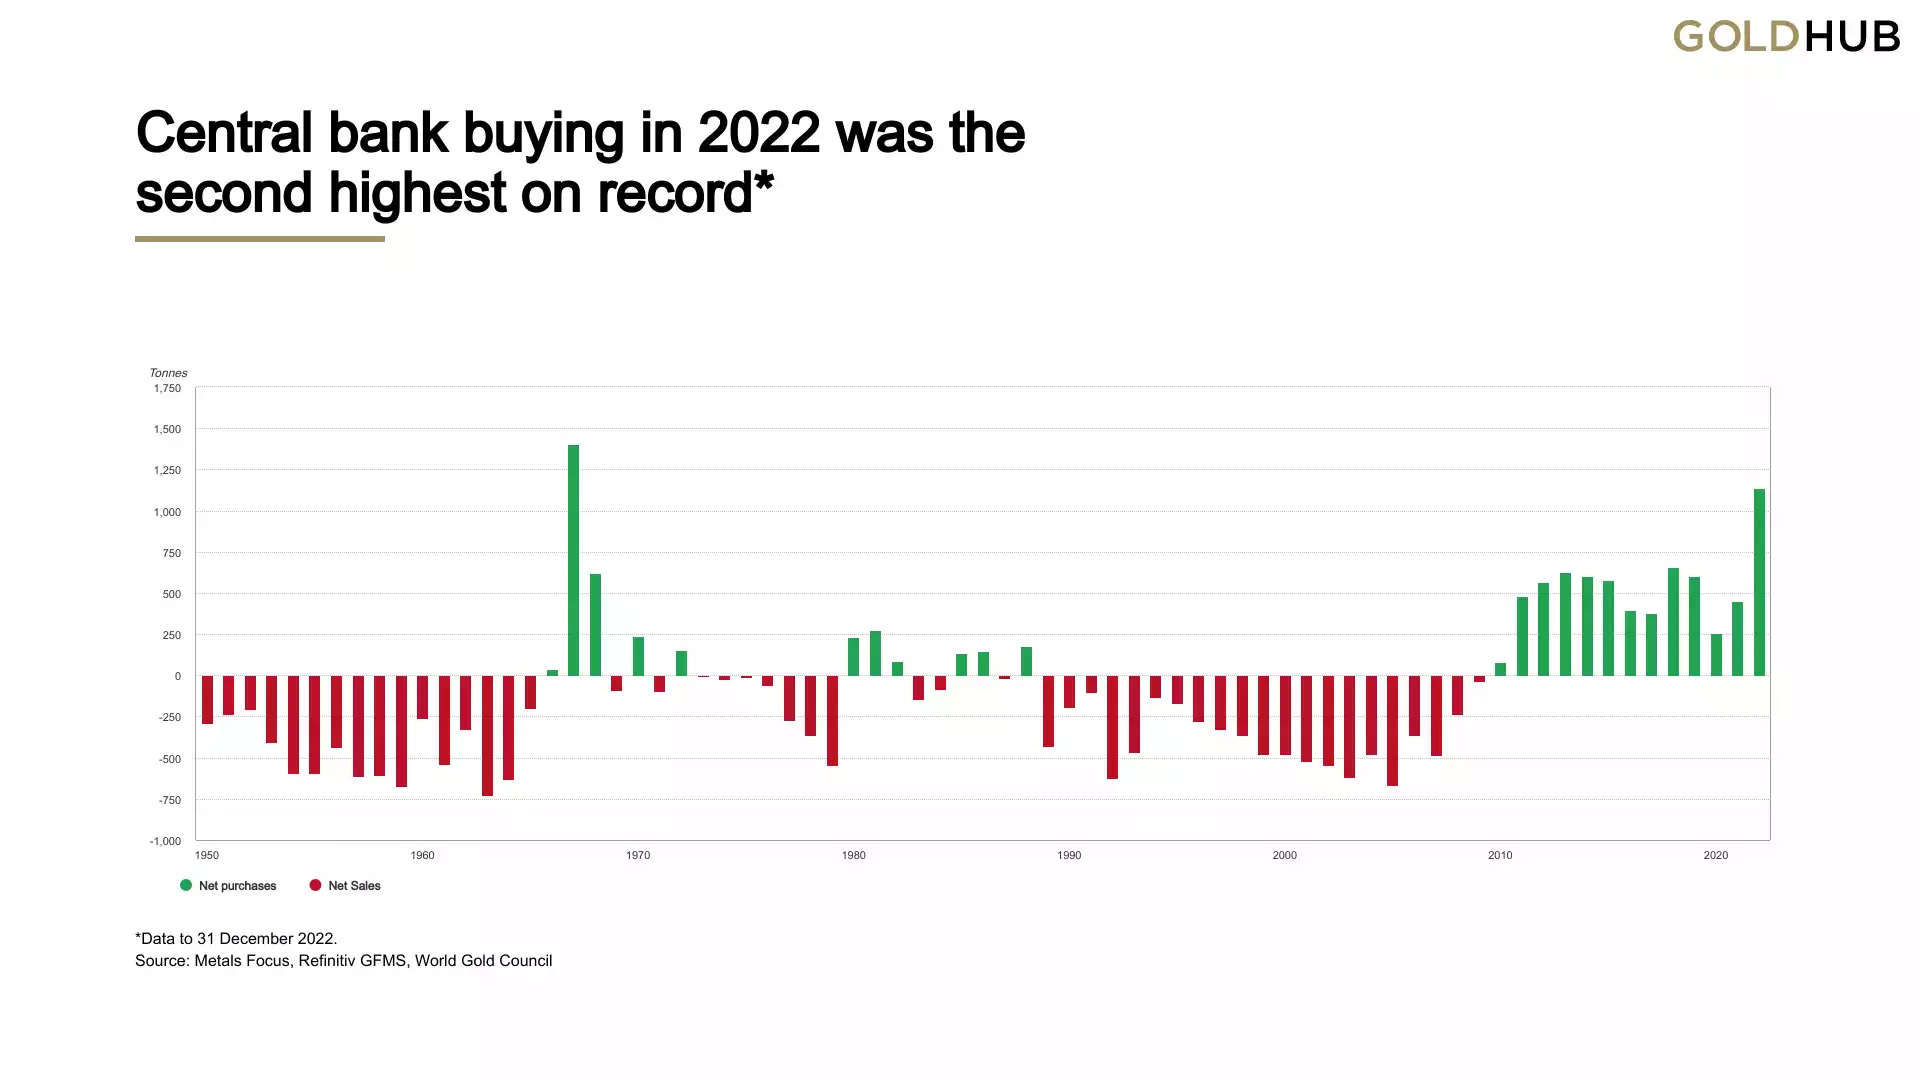
- Central bank demand totalled 1,136t in 2022, the highest level of buying since 1967. A 55 year high!
- Geopolitical uncertainty and high inflation were highlighted as key reasons for holding gold
- Buying was primarily from emerging market banks, including Turkey and China.

“Two years on from dropping to its lowest level in a decade, central bank demand has rebounded strongly. 2022 saw the second consecutive y-o-y increase in demand from this sector, with net purchases totalling 1,136t. This marked a banner year for central bank buying: 2022 was not only the thirteenth consecutive year of net purchases, but also the second highest level of annual demand on record back to 1950, boosted by +400t demand in both Q3 and Q4.”
Not to harp on, but… You see the trend here yeah? Since 1973 when this secular credit bubble started when we left the gold standard, investors and central banks alike no longer needed the ‘pet rock’ that was gold. Years and years of credit fuelled largesse and US abuse of its reserve currency hegemony ensued until the first reminder of it’s limits and inevitable catastrophic failure was dished up in the GFC. Since then, central banks, the very institutions doubling down on credit creation, have been buyers every single year and as we saw above, those investors who understand history as well.

Jewellery
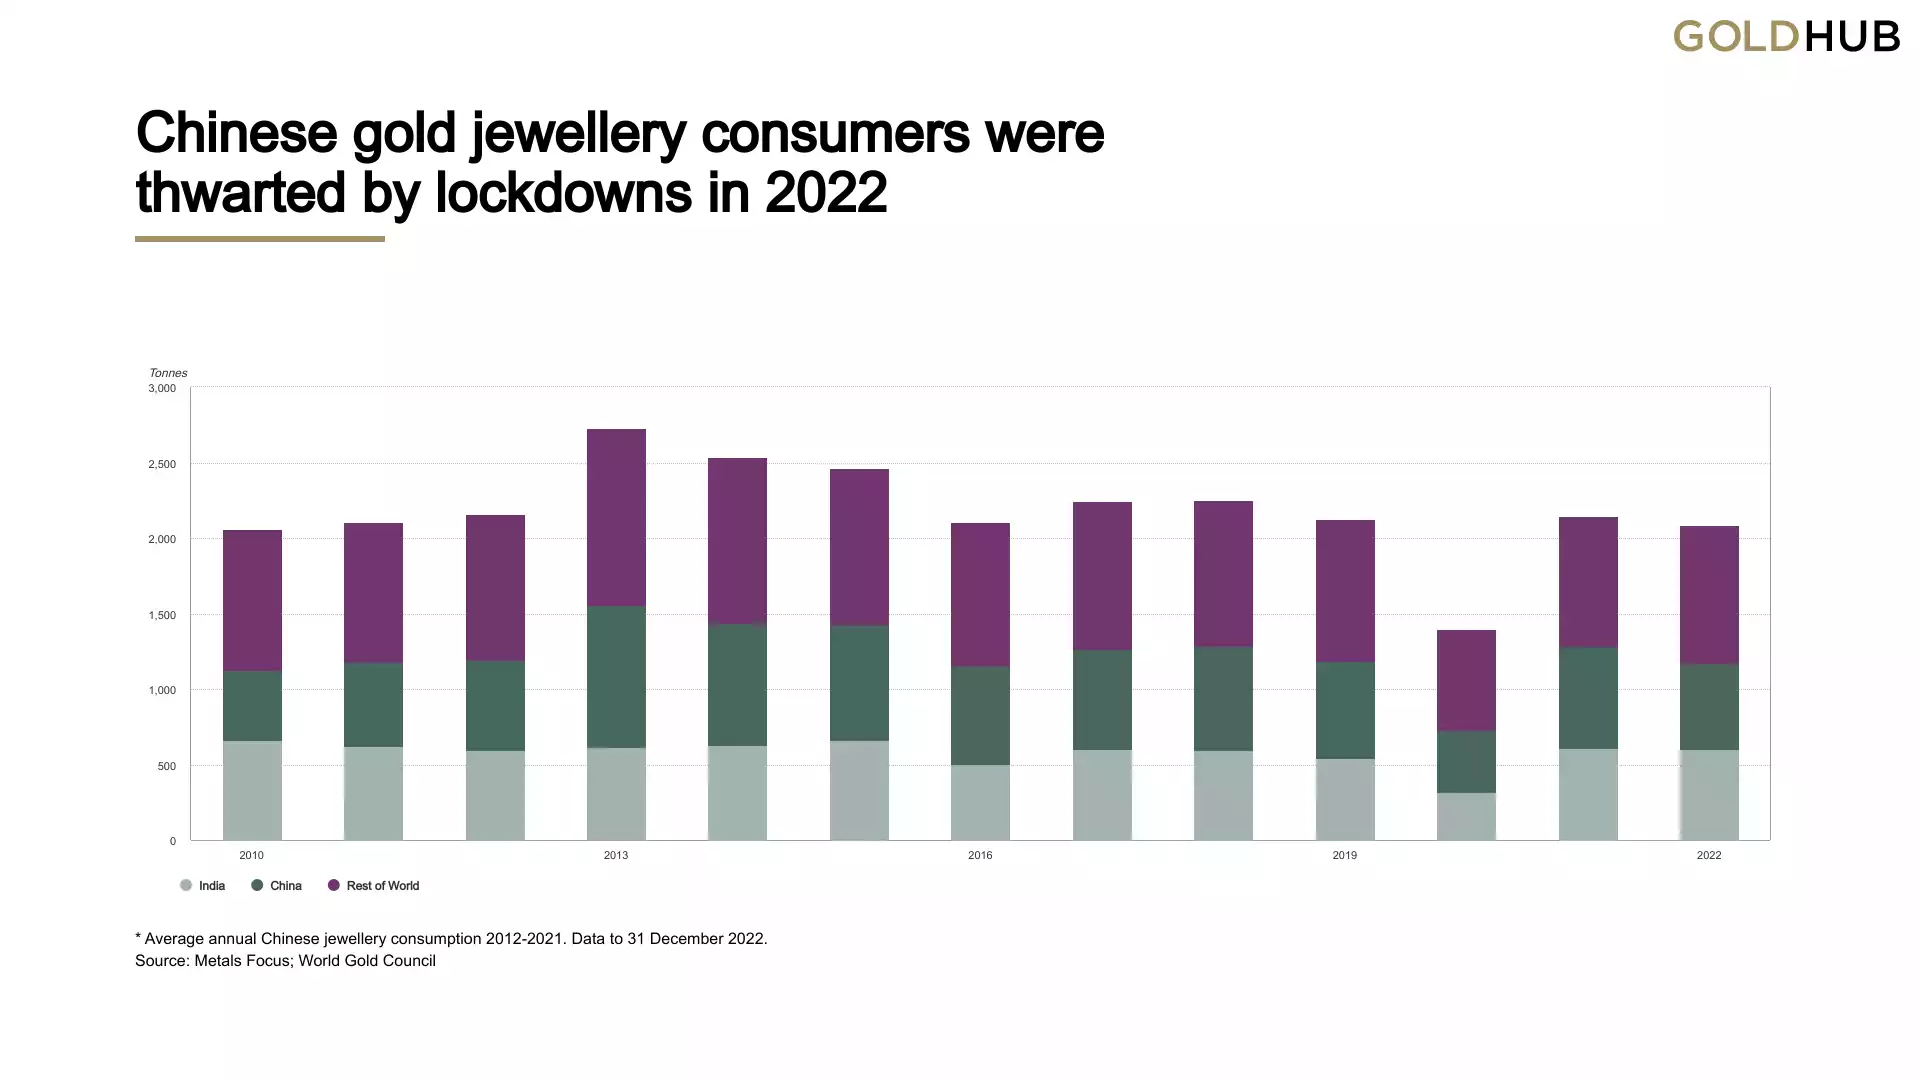
- Total annual jewellery demand saw a modest decline, 3% lower at 2,086t
- Steep declines in Chinese demand, weakened by COVID disruptions throughout the year had an outsized impact on the world total
- Global Q4 demand was down 13% y-o-y, a fall that was partly explained by the very high base of Q4’21 demand


Technology
- Worsening global economic conditions in Q4, together with trade restrictions and supply chain issues, generated a sharp drop in full-year gold technology demand
- A substantial drop in Q4 compounded Q3 weakness to generate a 7% decline in annual demand for gold in technology
- Electronics demand mirrored the 7% annual decline in the broader sector, dropping sharply in Q4 in response to the deteriorating global economic picture and supply chain challenges, particularly in China
- Gold used in other industrial applications was flat for the year.

Supply
- Total supply increased 2% y-o-y in 2021 as mine supply and recycling both posted modest growth
- Annual mine production increased 1% y-o-y although remains below the record high seen in 2018
- 2022 saw the global hedgebook almost unchanged over the year ending at 167t
- Full year recycled gold supply increased by 1% but remains 30% below the all-time high seen in 2012, despite a record annual average gold price in 2022.

And for those closely watching to see if 2018 was indeed ‘peak gold’, that is still in play with last year’s 1% growth still below that peak.

The supply numbers as always are important as they quietly remind us every single year that gold supply increases at barely 1 to 2% each year reinforcing its intrinsic value by virtue of stock-to-flow fundamentals.
USD money supply on the other hand….

No further comment needed but lets remember what Ray Dalio, head of the worlds largest hedge fund, famously said:
“If you don't own gold… there is no sensible reason other than you don't know history or you don't know the economics of it…”
**********************************************************************************
GOT A QUESTION about today's news?
This afternoon, the Gold & Silver Standard Insights team will be breaking down the news and answering YOUR questions.
Submit your question to [email protected] and SUBSCRIBE to the YouTube Channel to be notified when the GSS Insights video is live.
**********************************************************************************