Biggest Market Risks and Gold
News
|
Posted 09/02/2018
|
7134
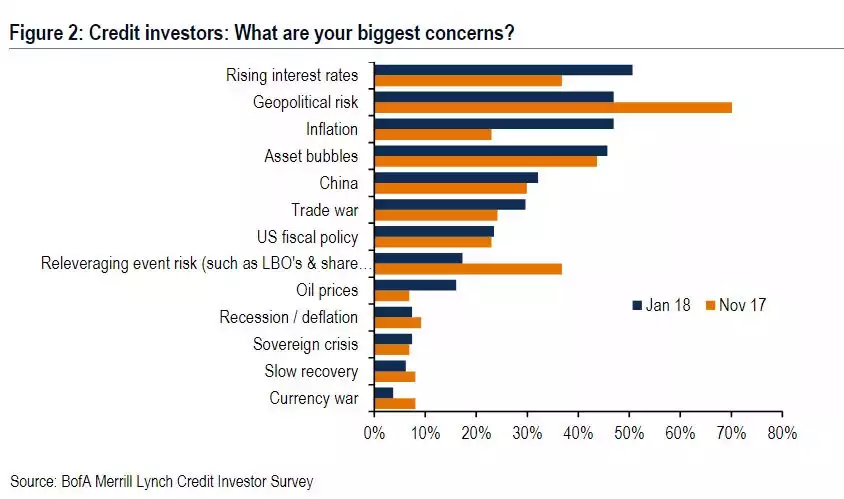
Last night saw another 1000 points off the Dow Jones and Volatility spiking wildly again. So what has the market so spooked? The chart below, courtesy of Bank of America Merrill Lynch maps it out:

We discussed on Monday what triggered all this and that chart confirms the mix of rising rates and inflation are front of mind. Again that seems counterintuitive for shares as it would indicate everything is awesome. We discussed on Monday the real implications when debt is so high but today let’s look at another factor. The velocity of money.
We have discussed many times the unprecedented amount of money injected into the system by central banks since the GFC. Initially it prevented the GFC getting much worse, and then it was to try and reflate the system and get things going again. Whilst that worked wonders for financial markets, inflation and growth stayed stubbornly low, and indeed we saw deflation in European markets in particular. How can you inject nearly $15trillion into the market and not see inflation and growth?
There is a fundamental, time proven formula in economics of:
M (money supply) x V (velocity of money) = P (price level aka inflation) x Q (real economic output)
Since the GFC we have had both low inflation and low growth. With M so high, that is virtue of a very low Velocity figure.
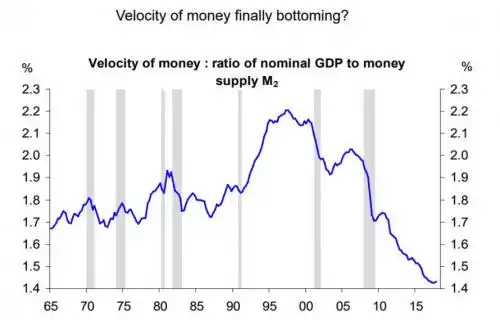
Now look at this next graph (courtesy of Deutsche Bank) showing the ratio of velocity of money (measured as the ratio of GDP to money supply of M2)

Yep, you’re looking at the worst in history, and that in the context of the biggest monetary stimulus program in history as well, some $4.5trillion in the US plus zero interest rates.
So where did all the money go if there was low velocity? Straight into financial markets. We have shown before the uncanny correlation between US shares and the Fed’s QE created balance sheet expansion.
The chart above now raises the questions of whether this has bottomed, are we about to see the inflation genie let loose, and have the Fed left it too late (again) to raise rates to stem the flow?
This has multiple implications for precious metals investors, particularly in Australia. Gold loves inflation and particularly loves low real interest rates. Real interest rates are nominal rates less inflation. If inflation takes off and the Fed are behind the curve that looks like the end result. As icing on the cake for Aussies, as the USD climbs on higher rates, the AUD should fall and turbo boost any USD spot gains in the metals.
Looking at the first chart above and you can tick Geopolitical risk as well as gold is traditionally a safe haven in times of war or geopolitical turmoil. And finally rounding out the top 4 – Asset Bubbles…
As we’ve witnessed this last week, when a market (both financial and property) is artificially inflated by unprecedented monetary stimulus, built on the biggest mountain of debt ever, and then the ‘money fairy’ (Fed) not only turns off the tap but turns up the heat via higher interest rates… well volatility comes back to town, and that’s the other thing ‘safe haven’ gold loves. Is this the ‘big crash’? No one knows. Will gold and silver holders sleep easy tonight regardless? You bet.