Why Last Night Baked in a Recession – 13 charts you can’t ignore.
News
|
Posted 13/04/2023
|
8685
Last night saw the release of the US CPI figures and minutes to the last Fed meeting, both key indicators for the trillion dollar question… ‘will the Fed hike in May??’ (they miss April). Whilst headline inflation was a little softer than expected at 5.0% (v 5.1% expected), core inflation rose (as expected) to 5.6%, and the Fed’s new favourite measure, the so called ‘Super-Core’ inflation eased slightly to 5.73%. However, wage growth is falling sharply and on any of the above measures, the US is nowhere near the Fed’s target of 2%. The March Fed minutes showed all Fed members backing the 25bps hike and continued Quantitative Tightening, their predicting a mild recession starting later in 2023 and continued concerns and risks to the downside around the banking crisis.
The inflation figures were heavily influenced by the drop in energy prices but one has to wonder what happens next now that the US has emptied its reserves and OPEC+ have tightened supply seeing the price of oil surge since this data was collated.
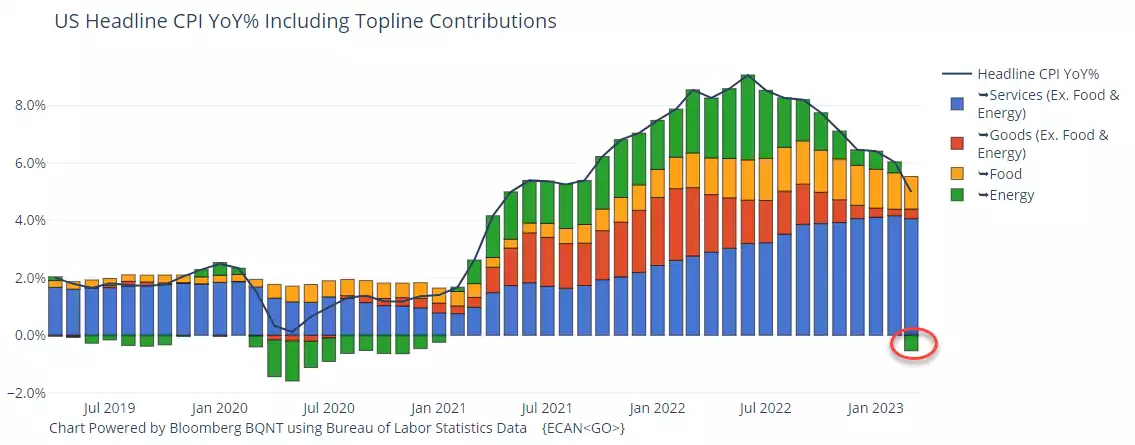
Markets reacted to both with shares down, USD down, gold up. Gold is benefitting from the prospects of a recession and that beautiful real interest rate correlation as the current minus 1% looks set to remain in gold’s sweet spot. On that, you can’t unsee the following ‘chart of truth’…

Last night saw a couple of members of the Fed maintain the (blue) line.
Barkin - “I certainly think we are past peak on inflation, but we still have a ways to go…..There’s still more to do I think to get core inflation back down to where we’d like it to be,”
Daly - “Looking ahead, there are good reasons to think that policy may have to tighten more to bring inflation down,”
So who is right, the market or the Fed?
The ‘market guy’ who gets it right more than most, Bank of America’s Michael Hartnett, recently produced a pro subscribers note with his “Dirty Dozen - 12 Recessionary Charts”
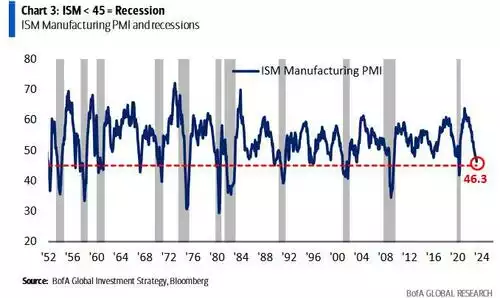
1. ISM < 45 = Recession
March ISM was 46.3, lowest since May'20; In past 70 years whenever manufacturing ISM dropped below 45, recession occurred on 11 out of 12 occasions (exception was 1967); Note the more important non-manufacturing ISM came in at 51.2, 4th weakest reading since GFC.
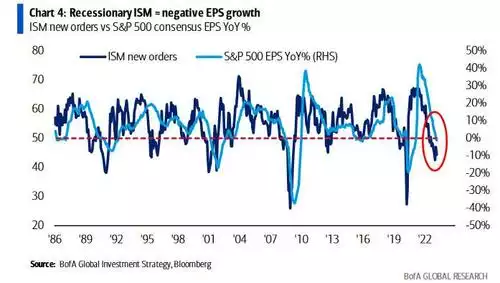
2. Recessionary ISM = negative EPS growt
New orders component of manufacturing ISM at 44.3; New orders < 45 have coincided with EPS recessions (see 1991, 2001, 2008, 2020).
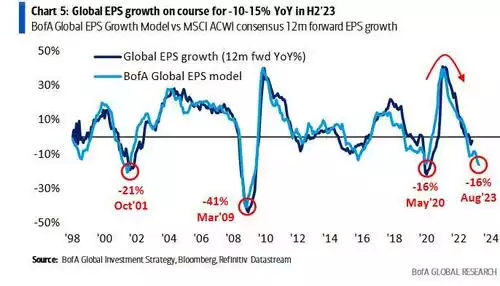
3. Global EPS growth on course for -10-15% YoY in H2’23
BofA Global EPS Growth Model currently predicts EPS to fall -16% YoY by Aug; Model is driven by Asian exports, global PMIs, China financial conditions, US yield curve.
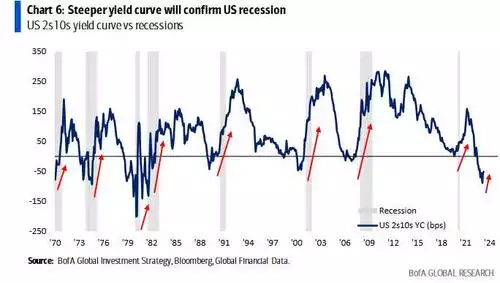
4. Steeper yield curve will confirm US recession
UST 2s10s yield curve flattens & inverts in anticipation of recession; Yield curves steepen immediately as recessions begin (as short rates fall in anticipation of central bank cuts); UST 2s10s yield curve has steepened from -110bps to -50bps in past 4 weeks.
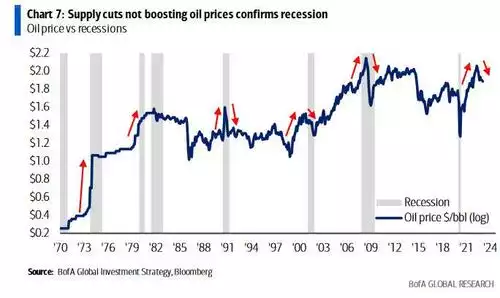
5. Supply cuts not boosting oil prices confirms recession
Oil prices historically rise into recessions and decline during recessions; Latest OPEC+ output cuts underscore recession concerns, with limited upward pricing pressures from China reopening so far; OPEC means oil price has a floor but the fact it’s not surging another recessionary hint.
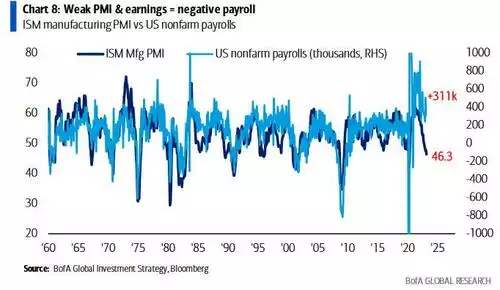
6. Weak PMI & earnings = negative payroll
Weak ISM manufacturing PMI suggests US labor market will weaken next few months; Note that ISM manufacturing PMI print < 45 has historically coincided with negative nonfarm payrolls and US recession; Feb’23 US payroll strong up 311k, Mar’23 forecast = 240k, but these are the last strong payroll reports of 2023
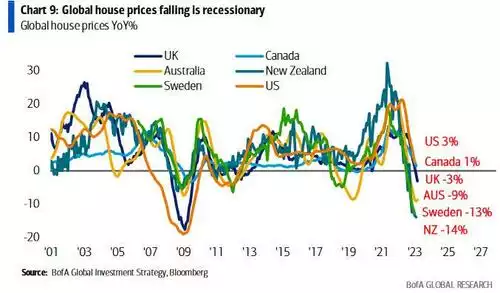
7. Global house prices falling is recessionary
Global house prices turning negative as higher rates hit real estate in US, UK, Canada, Sweden, Australia & New Zealand; Note NZ house prices down record -10.5% (per CoreLogic) & RBNZ just hiked 50bps.
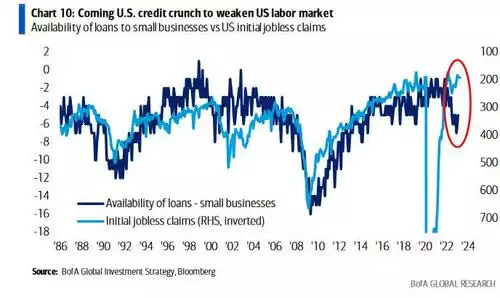
8. Coming U.S. credit crunch to weaken US labor market.
US banks have been tightening lending standards to small companies past few quarters; Credit crunch to intensify and highly correlated with small business demand for workers (US small businesses create 2/3 of US jobs); Should May SLOOS report show drop in loan availability to -10 or below = unambiguous credit crunch.
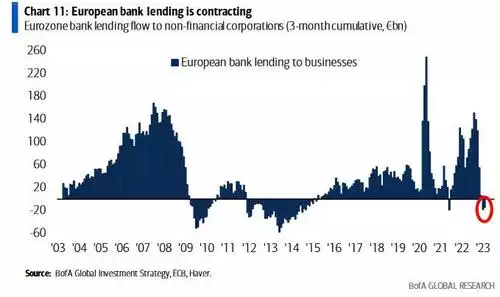
9. European bank lending is contracting
Bank lending in Eurozone down 3 months in a row (very rare outside GFC, Euro debt crisis, COVID); $14tn Eurozone economy highly dependent on bank credit (85% of corporates’ funding is channeled via bank loans).
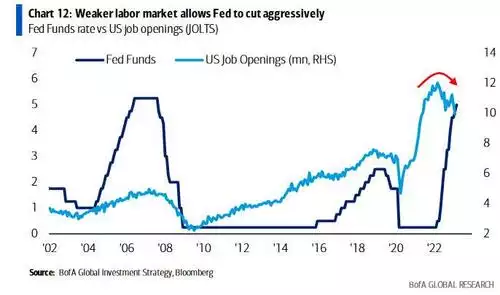
10. Weaker labor market allows Fed to cut aggressively
US JOLTS data showed job openings down >2mn from 12mn Mar'22 peak... and falling US job openings = weaker labor market = lower Fed funds rate; ...yield curve likely to steepen very dramatically next 6-12 months as Fed cuts ahead of election but long-end downside inhibited by inflation & fiscal shenanigans.
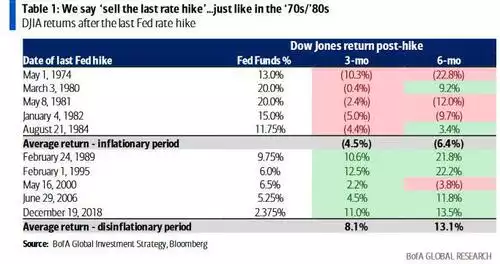
11. We say ‘sell the last rate hike’...just like in the ‘70s/’80s
Hartnett's view: sell the last rate hike; investors too optimistic on rate cuts and not pessimistic enough on recession; 'Sell the last hike' was correct strategy for stocks in inflationary '70s/'80s, 'buy the last hike' worked in the '90s+ disinflationary market; Stocks fell in the 3mo after every last hike in the '70s/'80s; Buy USD, sell gold, UST 30yr and IG credit outperformed consistently after the last Fed hike (in both inflationary and disinflationary periods).
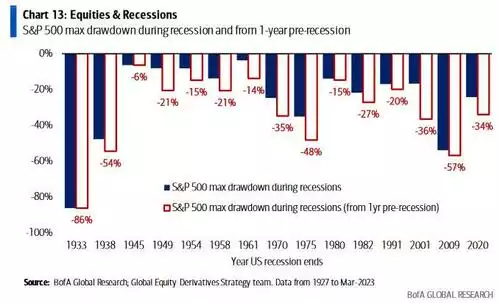
12. Equities & Recessions
BofA's Global Equity Derivatives Research Team show that recessions are reliably negative for equities throughout history and insufficiently discounted in advance; Plenty of room for more S&P 500 downside... since 1929, 2/3 of the S&P 500 peak-to-trough drawdowns have occurred during, not before, US recessions; 8 of the last 10 recessions saw S&P 500 drawdowns of over 20%.
Leaving Hartnett now we remind you of our previous ‘chart fest’ that showed just how gold performs during recessions in stark contrast to equities… You can see that here. (spoiler alert, over the last century the mean performance of gold compared to S&P500 during recessions is 44% better).
The Fed may be talking a mild recession but the above indicates ‘mild’ may be wishful thinking. The market can see they need to cut, but history tells us they will raise again or at best try to hold for (on average) 7 months before cutting. That in itself likely removes the prospect of ‘mild’. Prepare.