The Great Rotation – Silver to Boom
News
|
Posted 13/01/2021
|
42181
One of the more successful fund managers around is thumping the table about silver right now. Regular readers will know we respect the work of Crescat Capital. Why? Because they look objectively at the market and don’t get caught up in the passive crowd. Their performance also speaks for itself as you can see below, blowing away the competition:

So they have credibility and by not following the crowd into the abyss in the GFC their performance including that period sees them 100’s of percentage points above the benchmarks when inception predates that period. So what are they saying now? Here are some excerpts from their latest piece:
“It is time to gird for full Modern Monetary Theory. With the democratic sweep in place, we are about to experience even more of the double-barrelled fiscal and monetary stimulus that we saw in 2020. Overwhelmingly today, such policies have served to incite animal spirits toward financial assets. Investors are already positioned, all in, on both stocks and bonds in the US creating a highly imbalanced market. The problem is that money printing married with fiscal spending is crashing head-on with an emerging commodity supply problem that will likely stir up rising inflation which is bearish for both equities and fixed income. Get ready for a volatile 2021, the year of reckoning for twin asset bubbles as the world attempts to emerge from the Covid-19 pandemic.
The macro setup is in place for a self-reinforcing unwinding for stocks and rise in commodities akin to 1920-21, 1973-74 and 2000-02. On the long side of this trade, there are merely two sectors in the US stock market – energy and materials – that offer substantial value and upside potential today as part of this macro reconciliation. We believe the smart money is already rotating out of historically overvalued equities and fixed income securities and into undervalued commodities. Soon it should become a stampede, a reflexive great rotation.”
“The Fed is determined to increase the rate of inflation to ease the record debt burden dragging down economic growth. The fiscal powers will be playing along, so inflation is indeed what we are likely to get. Long term economic history proves that the forces of rising wholesale and consumer prices cannot easily be brought back under control by central banks once they get loose.
But what about the “output gap” in recent years, the theoretical paradox holding inflation in check due to an underachieving economy? And what about the deflationary forces of technological innovation and aging demographics? At this stage of the macro cycle, in our analysis, inflation is all about the “input gap”, i.e., supply shortages of primary resources. While the “new economy” has been enjoying the limelight in recent years, the stage for “cost-push inflation” has been set due to underinvestment in the “old economy” now that policy makers are about to pull out their biggest bazookas yet to boost aggregate demand.
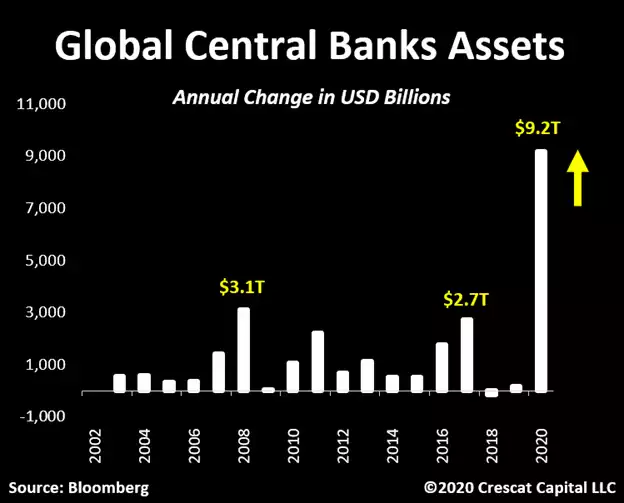
Global central banks added a total of $9.1 trillion of assets to their balance sheets in 2020. To compare, this year’s monetary stimulus was about three times their response to the Global Financial Crisis in 2008. We also saw at least $25 trillion of newly issued debt worldwide while the aggregate value of all negative yielding bonds reached close to $18 trillion in 2020. With this macro backdrop, it is staggering to see a monetary metal like silver still trading sub $30/oz.”
“With gold and silver closing the past year up 25% and 48% respectively, miners are in paradise. They have never reported this much positive free cash flow in a quarter. Over 60% of the newly generated capital was used to pay down debt, which was the largest quarterly amount in the history of this industry.”
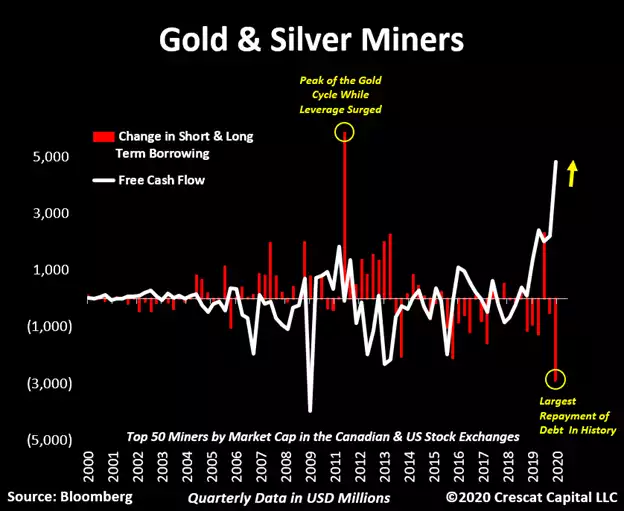
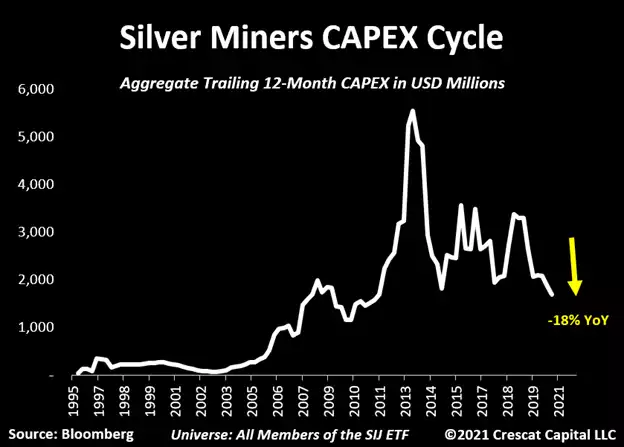
With such a massive paydown in debt and all that free cash flow, one would likely assume they would be deploying funds to look for new deposits and improve production capacity… But quite the opposite has occurred:
“While we have shown in past letters that future gold supply is historically constrained due to underinvestment, the lack of investment in silver mining looks even worse. One way to see this is by looking at the capital spending cycle for miners that more prominently focus on silver production. If we look at the SIL ETF members as a proxy, their aggregate CAPEX just reached a decade low.”
As we wrote to on Monday, we are seeing real signs of inflation taking hold.
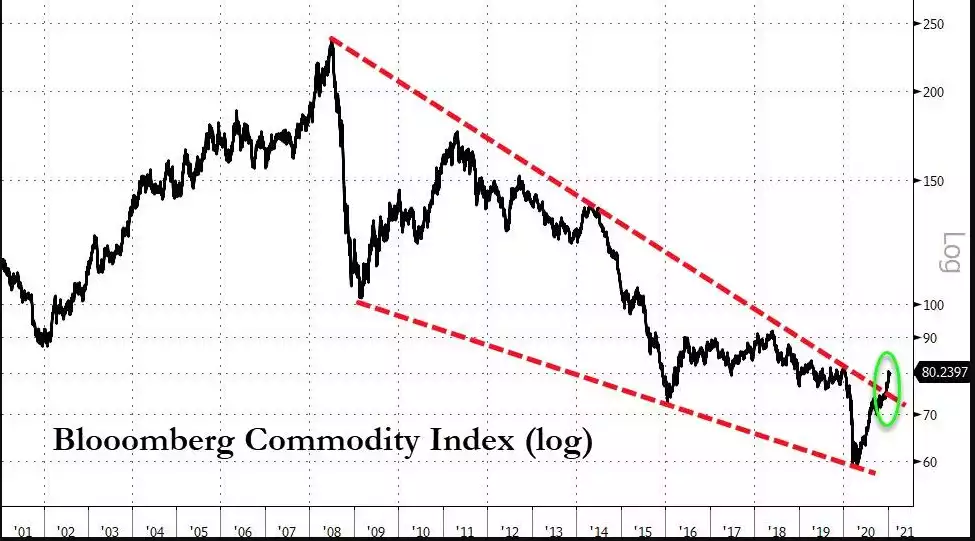
“Inflation continues to gain force. As we elaborated extensively in our prior letter, rising consumer prices are likely the end game for speculative asset bubbles in the financial markets. In the last several weeks we noticed an important move in that direction. Commodities just broke out from a 12-year resistance line. We have not seen this asset class sustainably appreciate in a long time. It is now occurring while the Fed seems forced to continue running the economy hot. Monetary policy has become a funding mechanism for government spending. Massive central bank purchases of Treasuries also serve to suppress interest rates while enabling the US government to run a large fiscal deficit. We believe the combination of unprecedented levels of government stimulus with investors beginning to flock to scarce commodities and driving these asset prices up, it will set an inflection point for inflationary forces.”
Crescat refer to the chart below
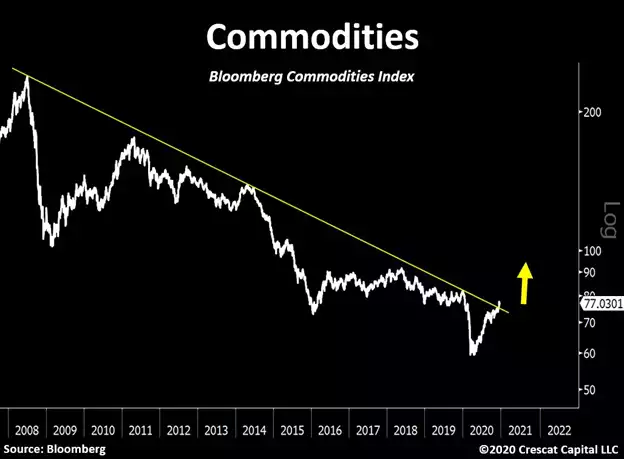
However zooming out even more, you are reminded of what this index did in the epic gold and silver rally from the turn of the century and also the big run up silver had to 2011, again on the rising commodities index.
Last night silver gained nearly 3% in the session with gold up 0.6%. That is a not an unusual trend as the GSR drops.
“Since March 2020, the outperformance of silver and the mining stocks relative to gold only adds to how early we believe we are in the cycle for precious metals. Looking back in history, gold tends to lead during the bottoming and early bull market phase of the cycle. Gold outperformed silver and mining equites from its 2015 lows up until March 2020 at which time the other two groups completed a full retest of their 2015 lows. Since March, silver and stocks have led as gold has also moved higher. A look at the gold to silver ratio in the chart below shows that it has drastically moved lower since March and is ripe for an even more meaningful multi-year breakdown. This is an important piece of the macro puzzle. After the initial phase of gold’s relative strength, silver and the mining stocks tend to outperform for the duration of the precious metals bull market.”
