Record Silver Inflows Tell only Part of the Story
News
|
Posted 06/07/2020
|
28356
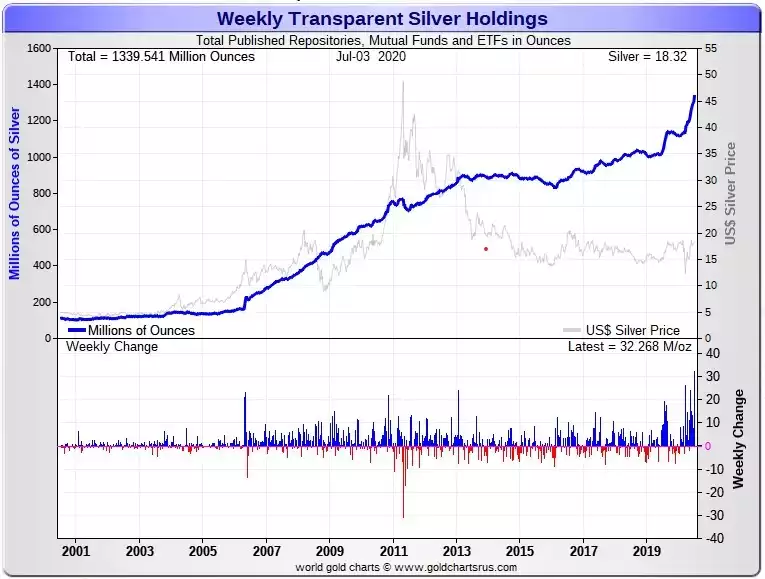
Last week saw an important new record for silver investment. Last week saw the highest ever inflows of silver into depositories holding metal for ETF’s and mutual funds etc. No less than 32,668,000oz of silver was deposited to back up these paper promises. For context, that is double the total world silver production for the same time period. It also takes total silver holdings for these funds to a new record high of 1.34b oz.

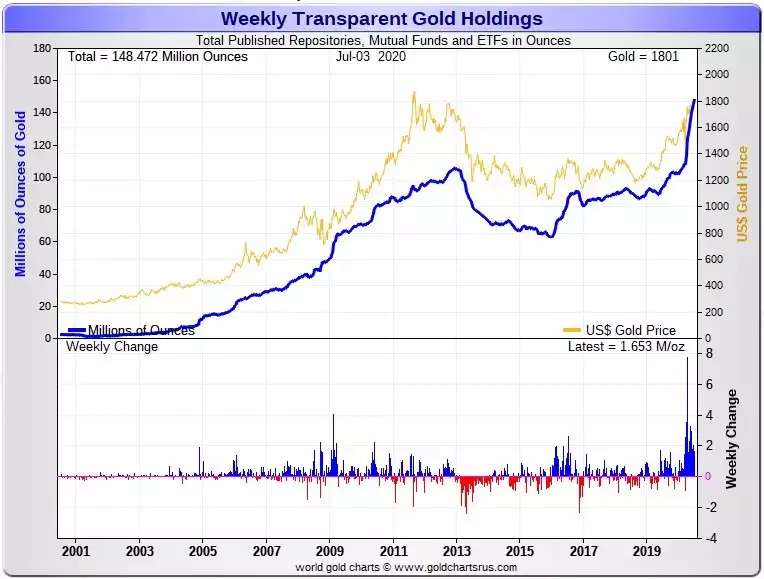
Gold too saw a new all time high of 148.5m oz after 1.65m oz were added in just one week.

The above two charts are notable for a couple of other reasons. Firstly you can see the incredible amount of metal that has flowed into these new funds since their inception in 2004. Whilst most bullion investors wouldn’t touch these paper derivatives with a barge pole, they should also be happy that these funds add a new avenue in for those happy with the risk. Those avenues are a large new demand generator for both metals. The second and glaring takeaway is the way the gold price (in yellow) has pretty much mirrored holdings whereas the silver price disconnected in 2013. And hence what we have seen is surging demand with little corresponding price movement compared to gold, albeit the extent of the scales distorted by that extraordinary 2011 silver price surge.
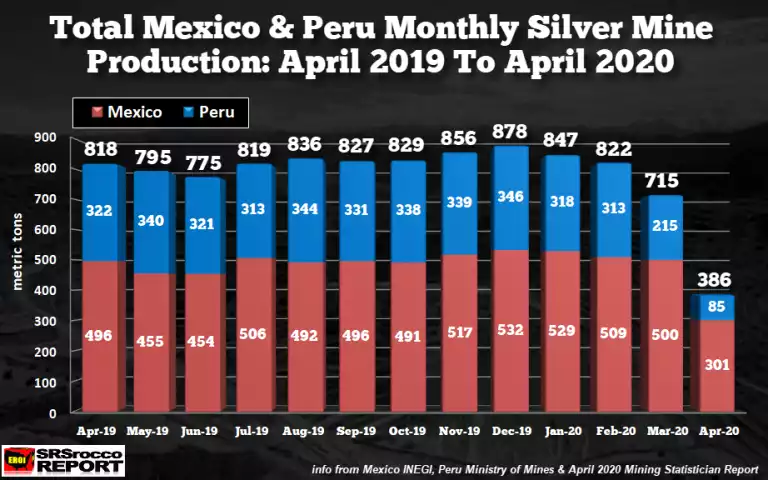
Such distortions in this silver market are many. We recently wrote of the plummeting mine supply of silver and we now have further confirmation of just how bad it really got for the world’s 2 biggest producers. As you can see below Mexico and Peru saw production drops in April of 432 tonne (14m oz) with expectations of a repeat of this in May.

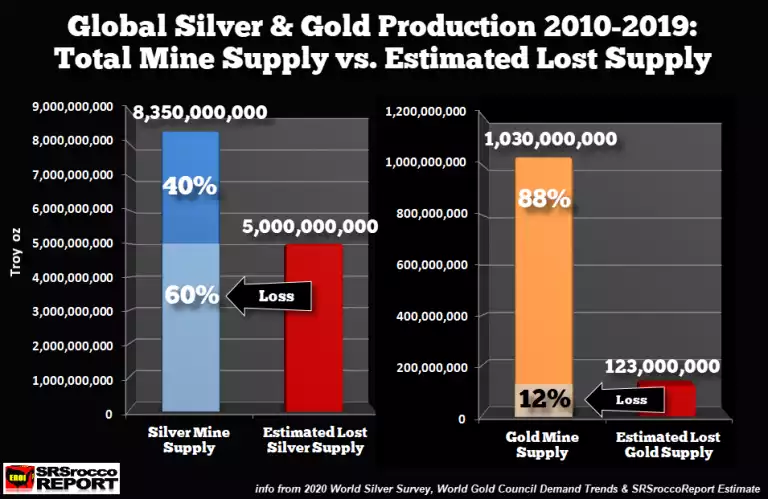
The guys at SRSrocco also undertook an interesting study into the question of so called ‘above ground supply’ of silver. Some debate rages over what the figure is. The latest Silver Institute 2019 World Silver Survey states there is around 2.5b oz (79,000 tonne) of identifiable above ground silver stock. That is just a fraction of the estimated 51b oz that has ever been mined which silver sceptics quote. However the fact is most of that has been discarded as it is used in industry, silverware and jewellery and won’t be economically recycled. Estimates on how much is held in investment form varies but 4b oz appears to have some science behind it. That same SI report has identifiable investment stock at around 2.5b, the 1.34b oz identified in the first chart (but less then) plus stock identified in Custodian Vaults. However the questionable validity of that latter vaulted metal plus not accounting for all that privately vaulted and held ‘under the mattress’ sees the 4b oz estimate arise.
“Here is why silver will be a much better-performing investment asset in the future than gold.
Silver vs. Gold: Mine Supply & Recycling (2010-2019)
Global Silver Mine Supply = 8.35 billion oz
Global Silver Recycling = 1.86 billion oz
Silver Recycling-Mine Supply Ratio = 22%
Global Gold Mine Supply = 1.03 billion oz
Global Gold Recycling = 424 million oz
Gold Recycling-Mine Supply Ratio = 42%
Because only 8% of world gold demand is in the technology sector (2010-2019) versus approximately 50% for silver industrial consumption, most silver mined is economically lost forever. During the ten-year period, 4.8 billion oz of silver was consumed in the industrial sector. On average, only 20% of the annual industrial silver demand is recycled. Thus, less than 1 billion oz of that total 4.8 billion consumed in the industrial sector will likely be recovered.
Thus, adding up the possible recycling from that 8.35 billion of silver mine supply in the Industrial, Jewelry and Silverware sectors, and adding it to the physical silver investment demand (assumed at 100% recycled), I arrived at approximately 3.3 billion oz of silver NOT ECONOMICALLY LOST. By subtracting the two, I came up with the 5 billion oz of Economically Lost silver supply.”

It is important to understand this dynamic when looking at monetary equations such as stock to flow and the like. It is also critical to look at this when considering a Gold Silver Ratio (GSR) still hovering close to 100:1. This latent price action of silver against gold is the same action we’ve seen time and again as that GSR drops to its historic mean and beyond as the price of silver rockets against an already rising gold price.