NAB Flags AUD Set to Fall – History Repeats?
News
|
Posted 15/05/2019
|
9324
Whilst last week the RBA held rates unchanged, as we reported at the time, all eyes will be on tomorrow’s unemployment figures for the next cue on ‘will they or won’t they’ cut rates next month. The RBA conceded they would likely need to cut rates if employment deteriorated or even stayed unchanged.
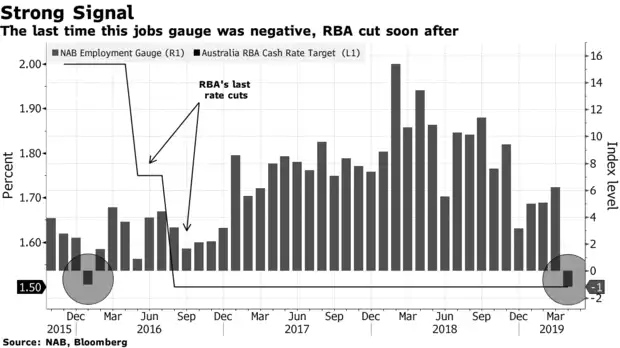
Yesterday NAB released their latest business survey and employment index. It didn’t bode well for tomorrow, dropping to -1, the weakest reading since January 2016 and first negative print in that same 3 year period. As you will note below, soon after that 2016 print, the RBA started cutting rates.

The current 5% unemployment rate has in the past been considered ‘full employment’. However our ‘new normal’ of a slower economy, persistently low inflation and record low wage growth has economists now considering 4% as the new target. This survey suggests we won’t see that happen, putting the onus on the RBA to cut rates to spur on the economy, raise inflation and put pressure on wages.
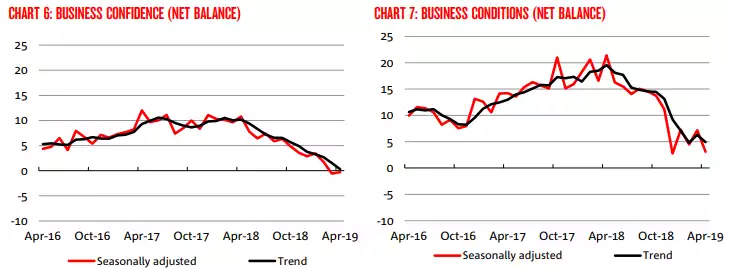
But the same survey suggests there is much heavy lifting to be done with business confidence at zero (albeit up from -1) and business conditions deteriorating from the surprise uptick in March of 7 back down to just 3. From the NAB executive summary:
“Overall, our read of the signal from the business survey is that the surprise jump in conditions last month was unwound this month – with business conditions, confidence and forward orders now all below average (a la February). A key development in the Survey this month was the sharp decline in the employment index to a below average read – the first since 2016. Future readings of this index should be closely watched as, for the most part, leading indicators of the labour market have remained positive to date but could be expected to decline based on the prior slowing in economic activity. Looking forward, business confidence and forward orders suggest ongoing weakness in private sector momentum with growth likely to remain weak in coming quarters. Capacity utilisation remains around average but no longer suggests a strong outlook for employment and capex. Overall, price pressures remain weak across the costs variables (including wage bill growth), suggesting that in addition to a slowing in the pace of activity in the business sector, there still remains spare capacity in the labour market.”
In 3 year context:

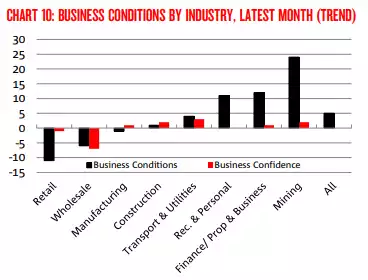
However, in the context of the US – China trade war, of which Australia stands to be a big loser, it is worth looking at the following chart to see where the positives of that business conditions number are largely derived… Mining…

Yesterday and continuing overnight the AUD has dropped to just 69.4c. You may not be surprised to know that the last time it was this low was… early 2016. Coincidence?

That drop of course is before any worsening of the official employment figures and any subsequent spike in the market expectations of a rate cut by the RBA. What the chart above also clearly shows is the speed with which our AUD can drop. Check out the GFC. From 96c to just 63c. An ounce of gold bought at 96c would be worth 52% more at 63c without the spot price changing a cent. That is the power of gold’s currency devaluation protection. History shows we can go way lower than even the current 69.4c. The global headwinds are against our AUD. That sharp rebound of the AUD in 2009 was nearly solely courtesy of China. Will they be there next time?