Gold, Silver & Stock to Flow
News
|
Posted 21/01/2021
|
7682
Yesterday’s article raised the financial concept again of Stock to Flow but dealt mainly with how it applies to Bitcoin. Today we go back and look more fully at stock to flow as it applies to gold and silver courtesy of an article penned by the infamous annual In Gold We Trust report from 2014.
“If a good is to remain money, the public must remain convinced that there won't be a sudden and unstoppable increase in its supply”
Ludwig von Mises
“Ludwig von Mises always held the opinion that gold is a good like any other. It differs only in terms of one important characteristic: money is the generally accepted medium of exchange, because it is the most liquid good. According to Mises, its role as a medium of exchange is therefore its crucial characteristic, while its function as a store of value and unit of account are only subsidiary features. This implies also that a rising money supply must lower the exchange value of money.
Supply and demand thus determine not only the prices of goods and services, but also the price of money, resp. its purchasing power. Confidence in the current and future purchasing power of money depends decisively on how much money is in existence currently, but also on expectations regarding the future supply of money. The more money is supplied – relative to the goods and services offered – the more its value declines.
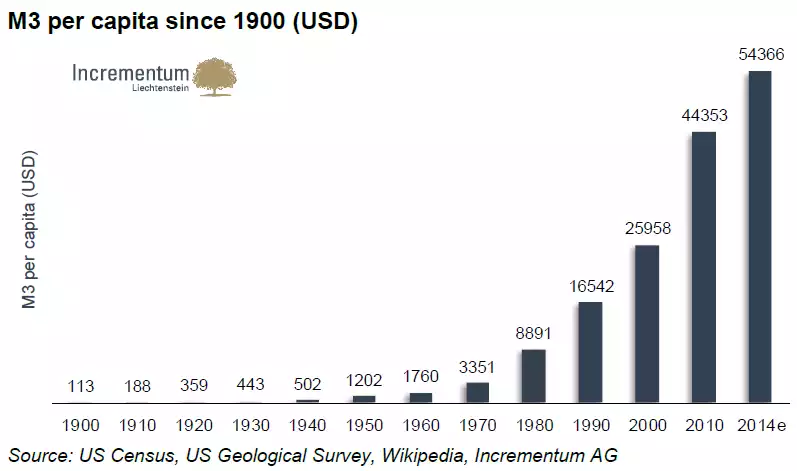
This can also be seen in the following chart. In 1913 the population of the US stood at 97 million people. The money supply M3 at the time amounted to approximately USD 20 billion, i.e., USD 210 per capita. Currently the population stands at 317 million people, while the money supply M3 has risen to USD 17.26 trillion. The per capita supply of money thus amounts to USD 54,366.
The next chart illustrates that the global stock of gold per capita since the beginning of the 20th century is fluctuating in a fairly tight range of 0.6 to 0.85 ounces. This is remarkable, as the global population has exploded from 1.65bn people in 1900 to some 7bn people today.
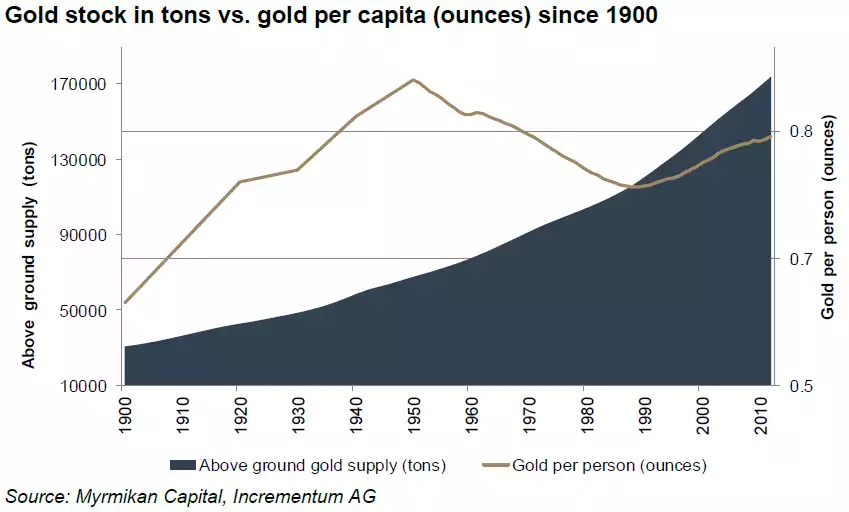
The gold supply curve only changes marginally. Scrap supply can be volatile, while mine production is highly inelastic. If one compares this to the supply curve of paper currencies, this is one of gold's major advantages: governments can print currency at will. There is no difference between the (digital) costs of printing a 100 euro note or a 10 euro note. There is, however, a substantial difference between producing 100 ounces or 10 ounces of gold. The former takes exactly 10 times the effort.
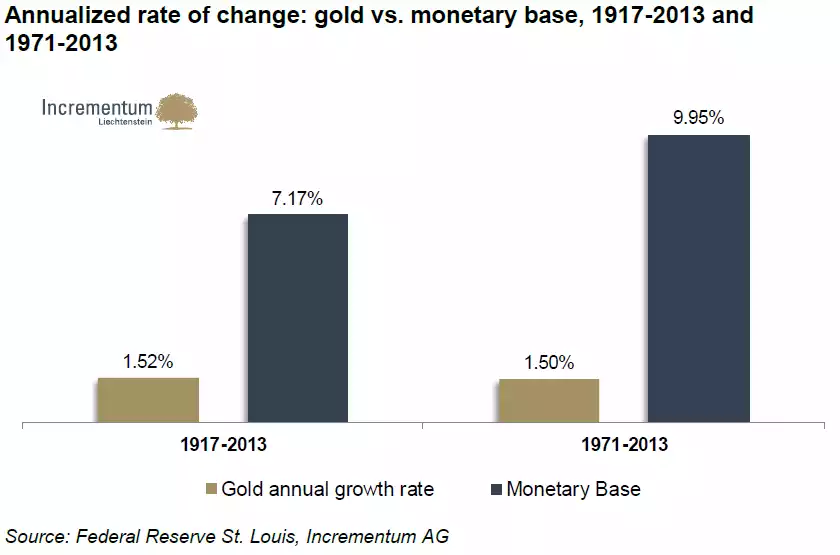
The following chart illustrates this “relative scarcity”. The average annual growth rate (CAGR) of the US monetary base between 1917 and 2013 amounted to 7.17%. The supply of gold by contrast only increased by 1.52% per year. If one looks at the rate of change since the beginning of the new monetary era – i.e., since the end of the Bretton Woods agreement – the growth rate of base money is actually significantly higher at 9.95%. The gold supply by comparison grew only by 1.5% per year in the same time period. This relative scarcity is the main advantage of gold compared to fiat currencies.
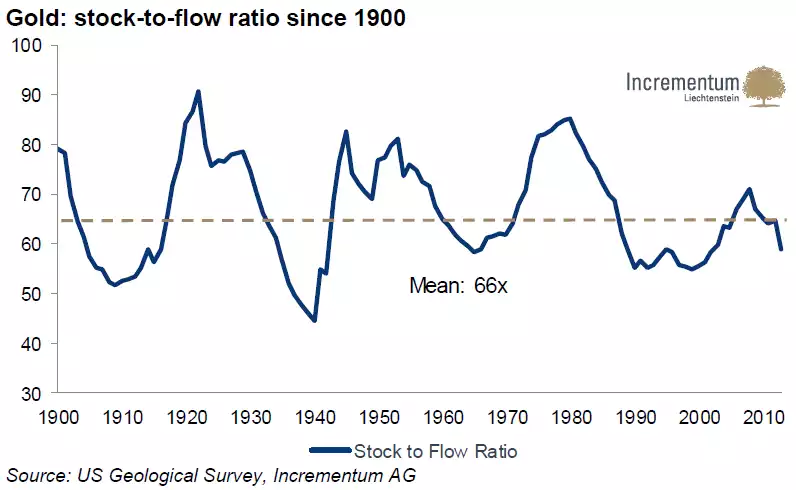
We have already discussed the crucial importance of the stock-to-flow ratio in our previous reports. Simply put, the ratio means that in the case of gold and silver – as opposed to other commodities – there is a major discrepancy between annual production and the total available supply (= high stock-to-flow ratio). As we stated last year, we believe that the permanently high stock-to-flow ratio represents one of gold's (and silver's) most important characteristics. The total amount of gold amounts to approximately 177,000 tons. This is the stock. Annual mine production amounted to roughly 3,000 tons in 2013 – this is the flow. If one divides the total gold mined by annual production, one arrives at a stock-to-flow ratio of approximately 59 years. The ratio expresses the number of years it would take to double the total stock of gold at the current rate of production.
The following chart shows the trend of the ratio since 1900. One can see that it fluctuates akin to a sine curve around a mean value of 66.
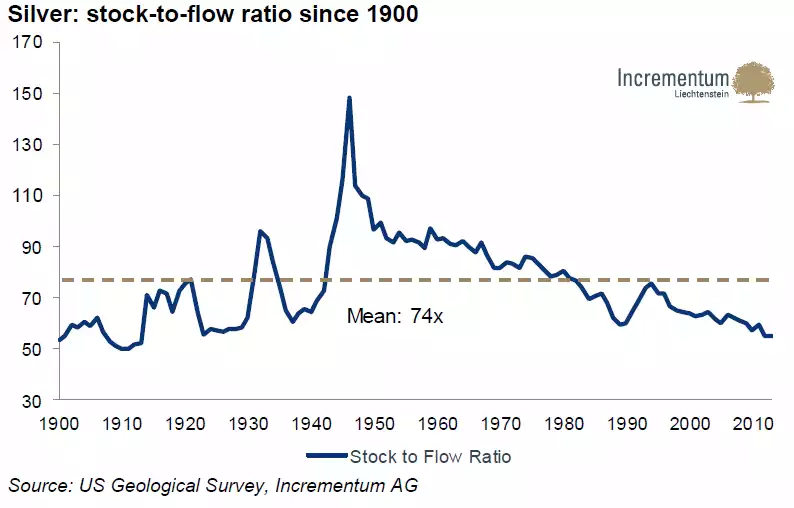
Silver's stock-to-flow ratio by contrast shows a definite long-term trend. Until 1951 it rose, and has been falling ever since.
The monetary suitability of gold, silver and the US dollar
In order to quantify monetary serviceableness, we have determined three sensible values based on the stock-to-flow ratio for gold, silver and the US dollar which are shown in the following table:
the average absolute height of the StFR
- the higher, the better the suitability as money
- shows how high the annual growth in supply usually is
the difference between the highest and lowest value of the StFR
- the lower the better the suitability as money
- shows what one must expect in terms of extreme outliers in the StFR in the long term (soundness – reliability – manipulability)
the Median of the annual rate of change of the StFR
- the lower, the better the suitability as money
- shows how large the short term fluctuations in the StFR are on average

As the above comparison shows, the US dollar as a representative of fiat currencies has the worst values on terms of all three criteria. Especially the last two figures illustrate quite starkly why the dollar is not suitable to function as stable money. Gold by comparison proves superior in two cases, and is only bettered by silver in terms of the mean value. This confirms once again that gold is the primary monetary metal.”