Bull or Bear Market? The “suckering”
News
|
Posted 02/04/2020
|
25948
On Friday we explained and warned of the Bull Trap phenomenon. Since writing that we have seen a replication of the chart shared showing how a bull trap works. Last night we saw US shares drop around 4.5% after drops the night before as well. Aussie futures suggest we’ll be down 3% too. Gold was up 2.2% in AUD terms and 1.1% in US.
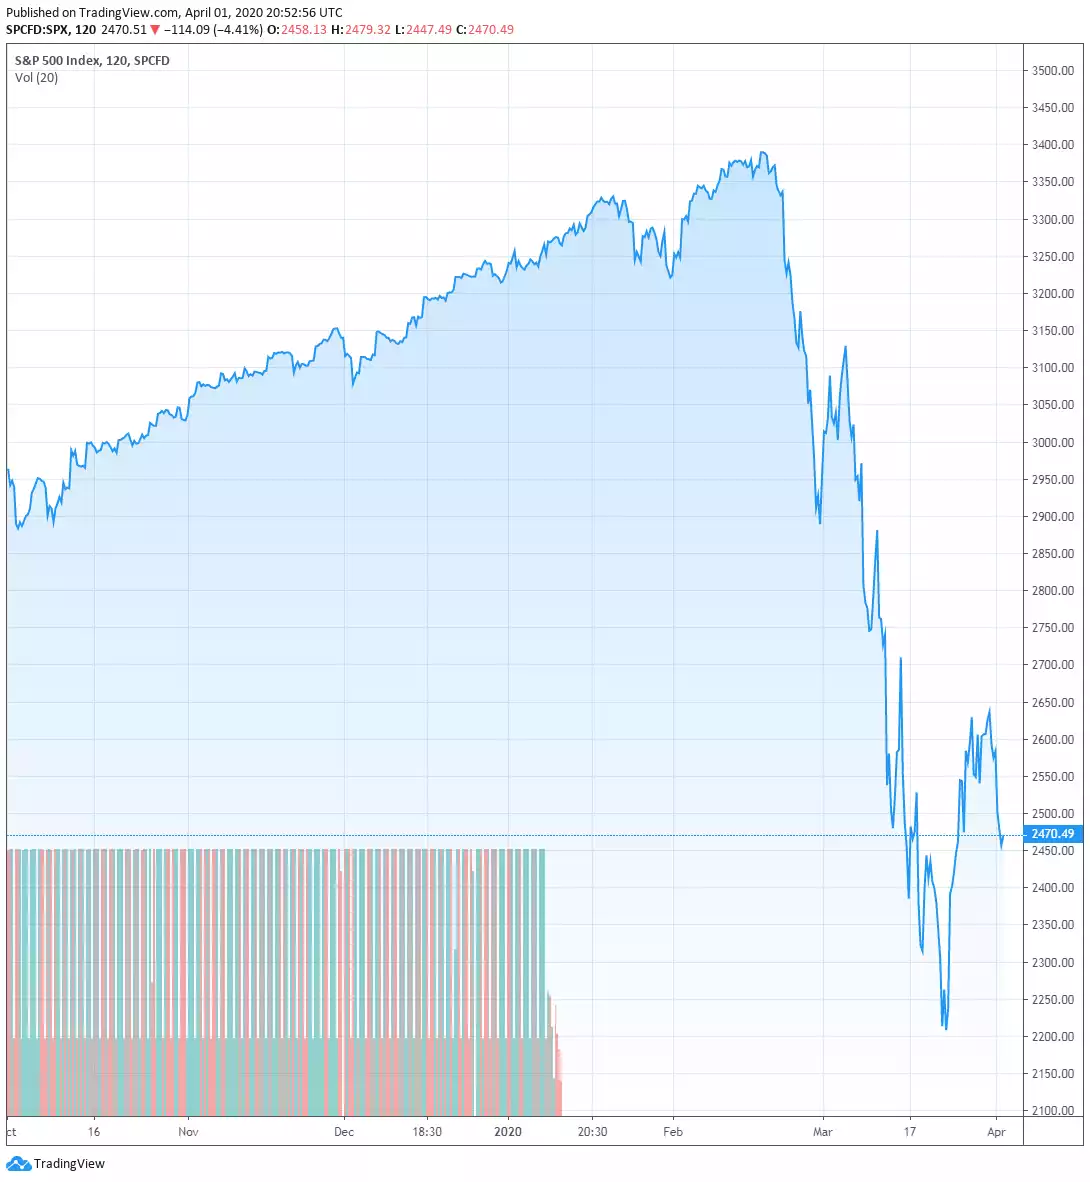
That’s not to say we’ve seen the end of the bull trap. 2 days does not give any clear indication and this market is likely to whipsaw for a while as people figure out that central banks printing money does not fix the fundamental problem of wholesale business closures and decimated demand.
Real Investment Advice’s Lance Roberts responds to the question “Is the bear market over” by raising 5 questions the bulls must answer. It’s a long piece so let’s summarise.
Employment
“Employment is the lifeblood of the economy. Individuals cannot consume goods and services if they do not have a job from which they can derive income. From that consumption comes corporate profits and earnings.
The chart below shows the number of full-time employees relative to the population. I have also overlaid jobless claims (inverted scale), which shows that when claims fall to current levels, it has generally marked the end of the employment cycle and preceded the onset of a recession.”
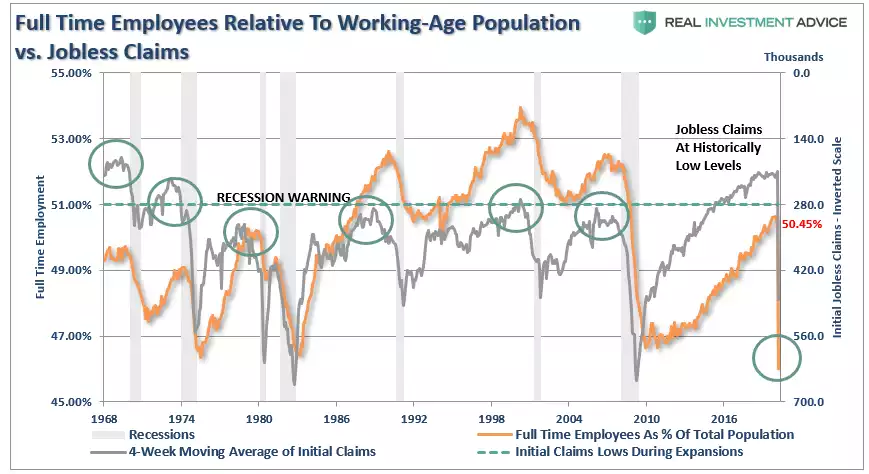
“While the Fed’s actions may prop up financial markets in the short-term, it does little to affect the most significant factor weighing on consumers – their job.”
Personal Consumption Expenditures (PCE)
“Following through from employment, once individuals receive their paycheck, they then consume goods and services in order to live.
This is a crucial economic concept to understand, which is the order in which the economy functions. Consumers must “produce” first, so they receive a paycheck, before they can “consume.””
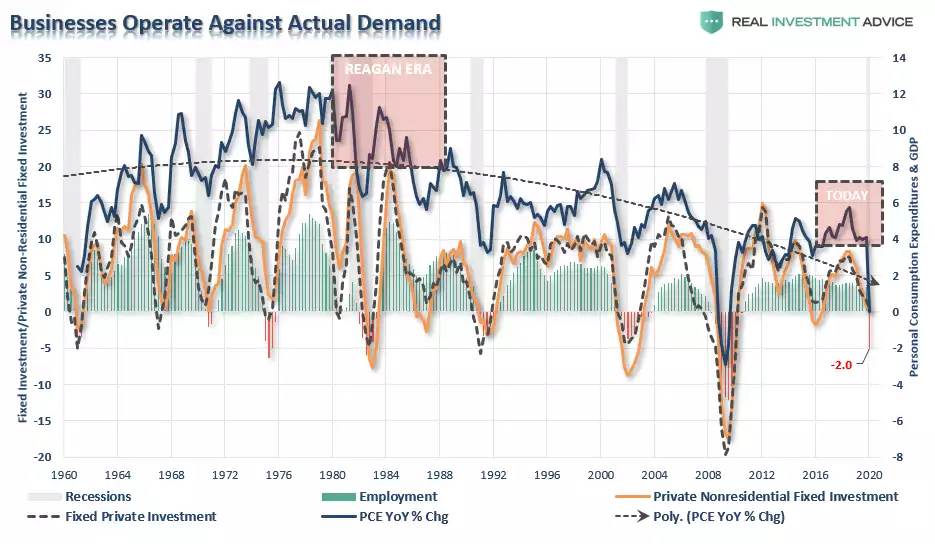
Consumption accounts for around 70% of US GDP and PCE measures that consumption. Without consumption, most business have no revenue and need to cut back costs including jobs and so the spiral goes. The chart below shows the cliff PCE just fell off with the first negative print since the GFC:
Junk Bonds & Margin Debt
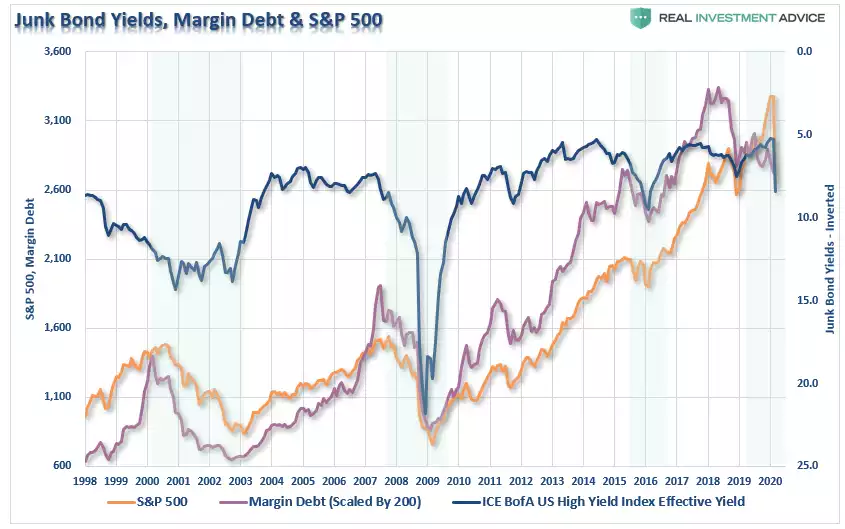
We have written extensively of the deteriorating quality and unprecedented size of the US corporate high yield (junk) bond market and the level of debt taken out to buy shares (both individuals and corporations). Roberts explains that the actions of central banks to inject cheap money into the system, suppress rates and otherwise intervene in markets to remove fear, has seen the chase for any yield without fear inflate both margin lending and junk bonds to record highs. The chart below shows that whilst these have corrected sharply, they are hardly at a level consistent with a new bull market. He also points out (before he saw last night’s further crash in oil) that we potentially aint seen nothing yet on a disorderly unwinding of the junk bond market with the enormous amount of energy bonds yet to price in the attack on the US’s expensive, and very highly leveraged, shale oil industry. Further we haven’t yet seen major corporations with record high junk bonds issues collapse or otherwise default as the effects of the virus inevitably see this happen.
Corporate Profits/Earnings
“As noted above, if the “bull market” is back, then stocks should be pricing in stronger earnings going forward. However, given the potential shakeout in employment, which will lower consumption, stronger earnings, and corporate profits, are not likely in the near term.
The risk to earnings is even higher than many suspect, given that over the last several years, companies have manufactured profitability through a variety of accounting gimmicks, but primarily through share buybacks from increased leverage. That cycle has now come to an end, but before it did it created a massive deviation of the stock market from corporate profitability.”
“The only other time in history the difference was this great was in 1999.”

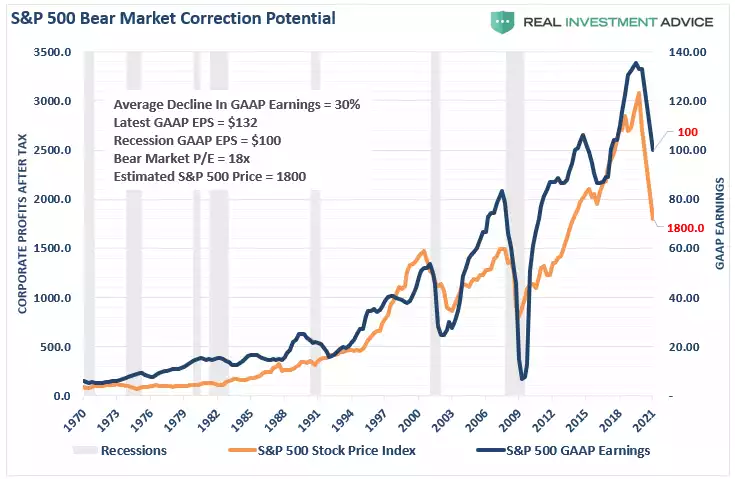
Looking at earnings per share, which have been at historical highs, Roberts then calculates where they should end up based on historical trends since 1936 at $100/share. Even the more bullish Goldman Sachs is down around $110. If you then apply that to the current market the chart below shows the S&P500 should fall to around 1800. That is another 27% drop from where it is now.
“The decline in economic growth epitomizes the problem that corporations face today in trying to maintain profitability. The chart below shows corporate profits as a percentage of GDP relative to the annual change in GDP. The last time that corporate profits diverged from GDP, it was unable to sustain that divergence for long. As the economy declines, so will corporate profits and earnings.”
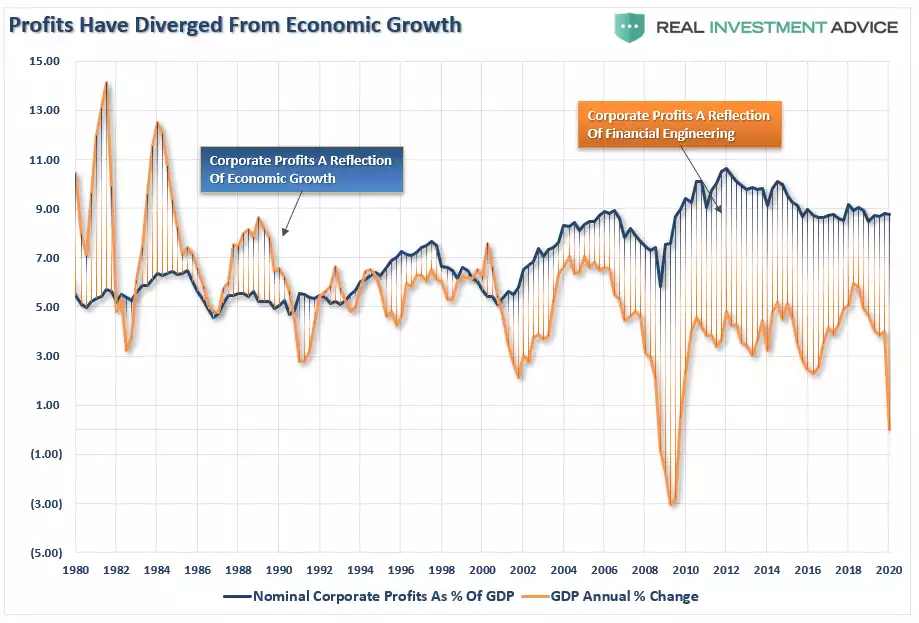
Whilst Roberts doesn’t discuss it, we find the above chart particularly notable as an illustration of the distortion from fundamentals of this credit cycle as the text boxes in the chart point out. The GFC could have been the clean out needed but instead the response was more debt to fix the debt problem. That saw the distortion exacerbated not fixed as clearly illustrated. The response already to this virus crisis is yet more debt funded stimulus, kicking the can further down the road. The question is whether this is the ‘reckoning’ that sees a reset of some sort. Someone, sometime must pay the price for the constant bringing forward of demand through debt. You may be buying gold for yourself but this may be the thing that saves your kids if they are the ones who pay the price for debt burden.
Technical Pressure
“Importantly, despite the sizable rally, participation has remained extraordinarily weak. If the market was seeing strong buying, as suggested by the media, then we should see sizable upticks in the percent measures of advancing issues, issues at new highs, and a rising number of stocks above their 200-dma.”

“While Central Banks have rushed into a “burning building with a fire hose” of liquidity, there is the risk that after a decade of excess debt, leverage, and misallocation of assets, the “fire” may be too hot for them to put out
Assuming that the “bear market” is over already may be a bit premature, and chasing what seems like a “raging bull market” is likely going to disappoint you.
Bear markets have a way of “suckering” investors back into the market to inflict the most pain possible. This is why “bear markets” never end with optimism, but in despair.”