Beware the Bull Trap
News
|
Posted 27/03/2020
|
45291
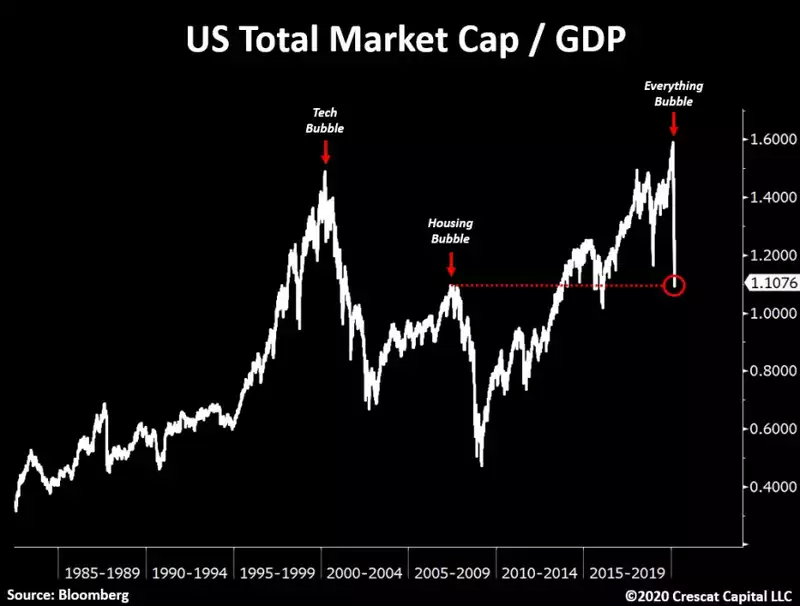
Phew! That was close!… We thought we were in a financial crisis there for a minute. But last night US shares re-entered a technical bull market just a week after a technical bear market. Yep, US shares are up 20% off the low last week. Everything is awesome and everything is fixed so buy the dip. Well, sure initial jobless claims in the US printed 3.3m for the week (5x higher than at the peak of the GFC), and sure after the correction that bought us back to ‘fair value’ barely got us back to the previous peak of the GFC (see below), and sure we are most certainly in a recession and one brought about by only the initial implications of a COVID-19 shut down rather than the realities still to play out…. But the Fed is printing and Donald is pumping $2trillion into the system so let’s buy!

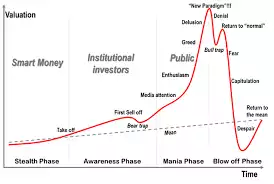
All jokes aside we have seen this all play out before. It’s called a bull trap and is a well known psychological market phenomenon mapped out below:

Crescat Capital have an enviable record of positive outperformance in times of market underperformance and they couldn’t be more blunt in their latest investor update:
“The crash was coming with or without the coronavirus pandemic. It started from record highs, historic leverage, and the most fundamentally over-valued composite of multiples ever, higher than 1929 and 2000. It was the longest expansion phase of a US business cycle in history. Now, it’s not just a US, but a global financial market meltdown, predestined by historic global debt to GDP and enormous worldwide asset bubbles. The Chinese banking system, and its currency by association, is largest of all today’s asset bubbles in our view, where there is much, much more to play out still on the downside.
Our performance since the top has been driven by diverse global short positions of over-valued global equities with deteriorating growth fundamentals and often bloated balance sheets. Also, in our global macro fund, our corporate credit shorts and sovereign bond spread trades have performed extremely well. Our shorts have done so well that we have generated these overall high returns at the same time as our precious metals long positions have pulled back substantially. When it comes to the precious metals side, we are convinced that the baby was thrown out with the bathwater.”
And in reference to this bounce (but presciently written before it happened):
“The market at large will bounce along the way, but maybe only after more short-term pain. For instance, in 1929 the S&P 500 and Dow Jones Industrials went down 45% and 48% respectively in the first two months. We are not there yet. The current crash won’t match perfectly but it should rhyme. The S&P 500 is down 32% already in one month. After the two-month plunge in 1929, there were 60% and 50% retracements respectively in the S&P 500 and Dow that lasted about four months through early 1930. We don’t think we are at that comparable point yet where we can get such a strong and enduring relief rally. Risk parity hedge funds that combine long equities with leveraged long bonds for instance are only just beginning to self-destruct.”
And in reference to the Market Cap v GDP chart above:
“After the 4-month relief rally into April 1930 during the Great Depression, the market headed down again in a big way before troughing two years later in 1932 with the S&P 500 and Dow down 86% and 89% respectively. We are only one month into this market crash and global recession. We expect stocks to be substantially lower from here before the bottom of this likely to be historic economic downturn. Total market cap to GDP for US stocks is only retesting the levels at “the peak” of the housing bubble as we show below. We are crashing from truly absurd valuation levels!”
So don’t get sucked into the ‘everything’s awesome’ US rally. ABC’s Alan Kohler spoke exactly to this on Tuesday night. If you missed it, you can watch it here (Although he mistakenly refers to it as a bear trap, instead of a bull trap).
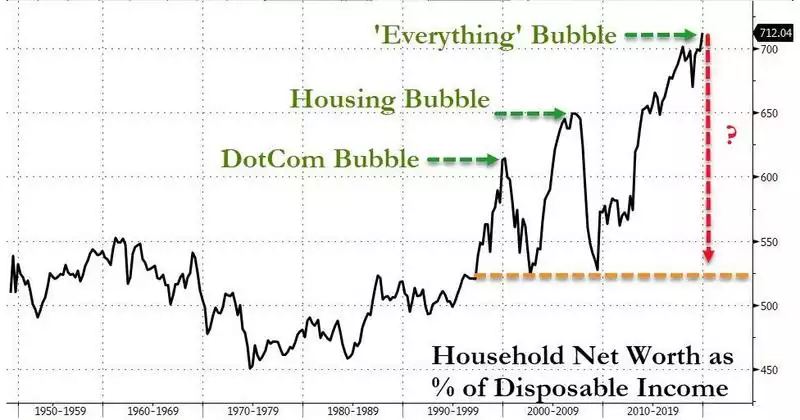
Beware the trap. That chart above shows a return to the mean. Below is a representation of that:
