Y Shaped Recovery & Record Market Concentration
News
|
Posted 05/05/2020
|
21908
Given the unprecedented nature of this economic crisis experts are understandably split on what the other side of it may look like. The question of whether there will be a quick V shaped recovery, slow U shaped recovery, false start W shape or Japan-like decades long L shape remains at large until hindsight provides the only accurate answer. More immediately the bigger question is how deep we get before any turn. That too will only be clear in hindsight though we clearly have a lot deeper to go yet. Probably the least discussed is the Y shaped scenario, one where the ‘market’ bifurcates, with part of it rebounding whilst the rest heads down, with the implication being the ‘down’ having no end in immediate sight, being a vertical element.
The thesis goes that some businesses, big ones who opportunistically gobble little ones with spare cash or cheap debt, or others that thrive in the effects of the virus shutdown, rebound while the rest collapse under a snowball of insolvencies.
Note we are talking about businesses there not ‘markets’ per se. Whether related or not, whether prescient or not, we are seeing some unprecedented Y shaped action in the world’s largest share index, the S&P500.
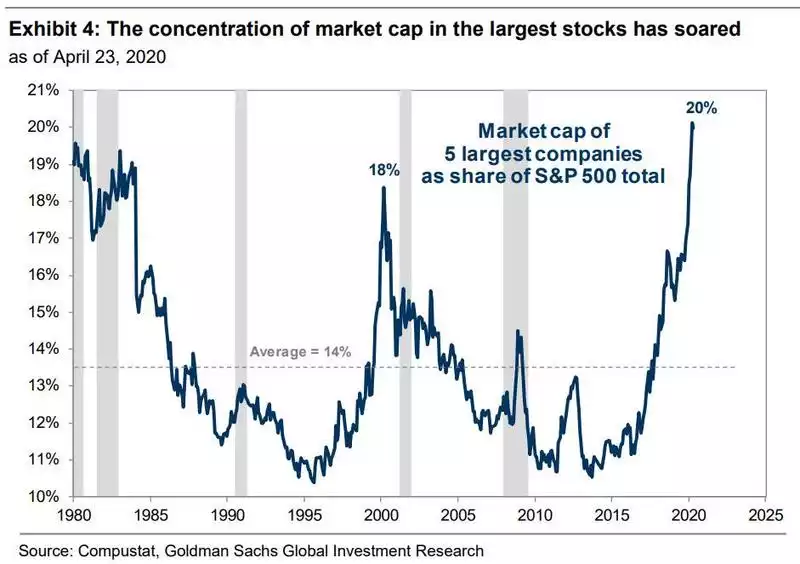
Goldman Sachs recently reported that in the biggest sharemarket index in the world, just 5 companies comprise 20% of the entire index market capitalisation. Facebook, Amazon, Apple, Microsoft, and Google, the so called FAAMGs have now formed the highest concentration ever. You may recall what happened the last time this happened when everyone was ‘all in’ the ‘this time is different’ tech stocks of the dot.com bubble.

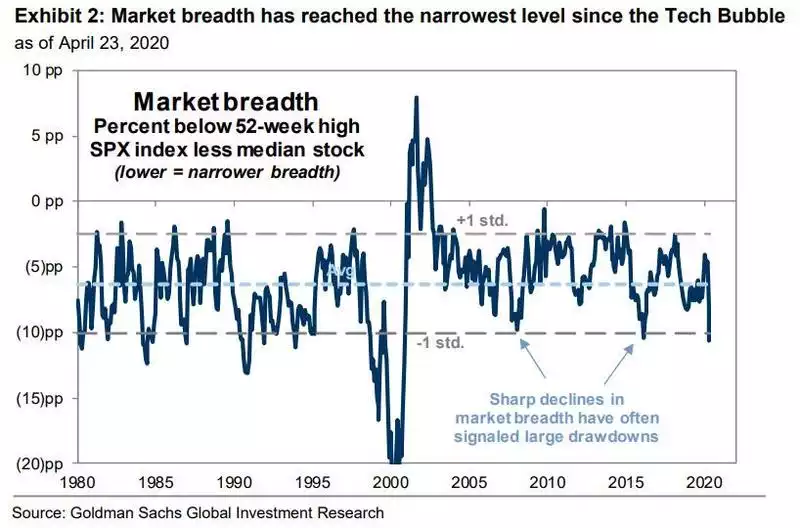
Goldmans said such lack of market breadth is “always resolved the same way” where “narrow rallies lead to large drawdowns as the handful of market leaders ultimately fail to generate enough fundamental earnings strength to justify elevated valuations and investor crowding. In these cases, the market leaders “catch down” to weaker peers."

The report goes on to note that the FAAMGs have collectively rebounded to be up 10% for the year despite the COVID-19 correction, whereas the remaining 495 companies are still down 13% despite the bull trap bounce. More broadly the S&P500 is down 14% from its February all-time high whereas the median is down 23%, such is the impact of those big 5.
Whether this phenomenon reinforces the Y shape recovery thesis or is coincidental will only be known in time. What is potentially more immediately concerning is, as Goldmans point out, that history tells us such drawdowns are usually a precursor to a broader market correction.
There is also a concerning concentration within this concentration. Just 10% of the US population own 84% of all shares held. More broadly the top 0.1% own more of total US wealth than the entire bottom 80%. This therefore makes the depth of the market participants combined with the breadth of the market itself a potentially perilous combination.