World Silver Survey Highlights This Epic Setup
News
|
Posted 24/04/2019
|
9045
Each year the Silver Institute releases their annual World Silver Survey report on supply and demand details for silver. They have just released their 2019 report covering the year of 2018. Below is their executive summary:
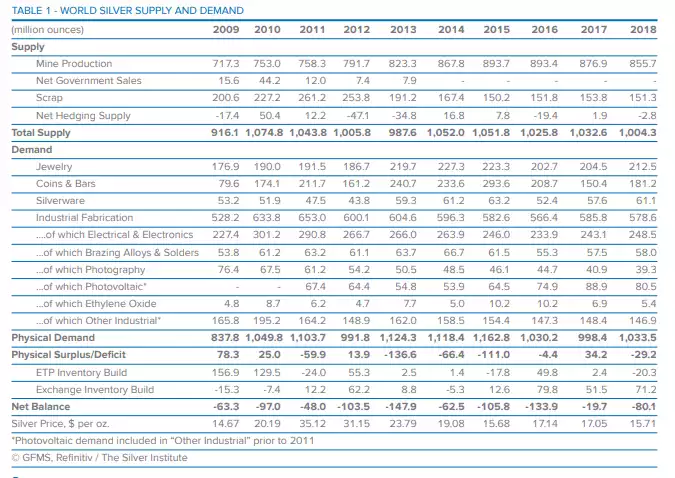
“Filtering out the noise in order to lift out the major changes that characterised the industry last year, three main developments stand out. First, physical demand increased 4% in 2018, propelled by a modest rise in jewellery and silverware fabrication, and a jump in coin and bar demand. Indeed, investment in silver bars and coins grew by an impressive 20% last year, driven by an exceptionally strong demand sentiment in India.
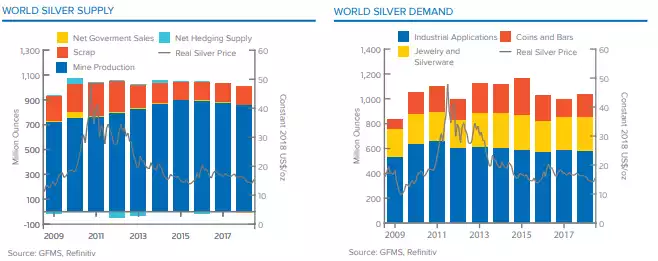
Second, Industrial fabrication lost 1% last year which slightly reduced its market share from 59% to 56%. Following three consecutive years of increases, silver demand from the solar industry took a breather in 2018. That might sound counter intuitively considering the continued commitments from the various governments to increase solar as a part of their energy generating portfolio, however, silver powder production fell due to continued thrifting and a glut of inventory that firstly needs to find its way through the system. The drop was countered by a rise of silver demand from the electronics and brazing alloys & solder sectors.
Third, for the third consecutive year, silver mine output fell, declining by 2% last year driven primarily by the lead/zinc sectors. In addition, scrap contracted as well, driven by the 8% decline in the average silver price, with fewer consumers incentivised to return their old jewellery and silverware items, pushing total silver supply for 2018 down 3%.
As a result, the physical market balance reached a minor deficit of 29.2 Moz (908 t), which is approximately 3% of annual demand and therefore, give or take, within the boundaries of error considered as a more or less balanced market. The small shortage was absorbed by metal made available from exchange traded products (ETPs), which recorded net-sales of 20.3 Moz (631 t) last year (only the third recorded net decline in ETPs this decade). A 38% net rise of exchange inventory build, however, pulled metal into the various global warehouses again, pushing the net-balance to a deficit of 80.1 Moz (2,491 t) in 2018.”

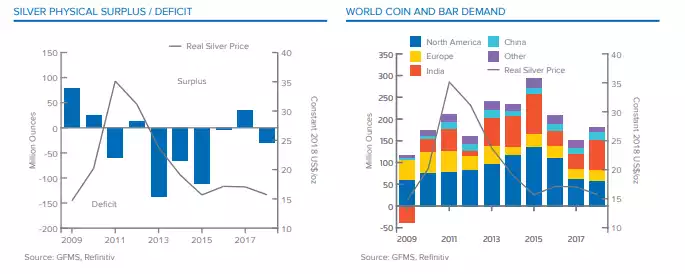
Delving into the report further there are some interesting graphs to contemplate. The charts below show the impact on ‘deficits’ and physical investment demand on the price. Apparently very little. This again highlights the thesis that JP Morgan et al are using the paper future trades on COMEX to suppress the price to amass their own physical hoard. Analyst Ted Butler estimates JP Morgan alone now owns around 850m oz of physical silver. They own around half of all physical inventories and more than their client’s paper short position. You can easily do the math from here. When they either want to or lose control, the world’s largest bank unwinds the paper short, lets the price rip, and owns the world’s biggest hoard of physical silver at those higher prices. We got a little glimpse of how quickly that can escalate in 2011 when silver neared $50/oz. It’s not a stretch to anticipate that during the next financial crisis silver could be JPM’s get out of jail card.

That of course is whilst the bank has ‘control’. Whilst evident in the table above, the charts below clearly illustrate the proportion of investment demand for silver, being only a quarter and relatively stable over the last decade. What happens when there is a rush to the metal by investors? We are reminded by the chart to the left that there is no ‘print’ button for silver. Supply is fundamentally and physically constrained and already currently not keeping up before any such demand spike. At some point either JPM et al take their foot off or math takes over. Either way it looks pretty compelling…
