World Silver Survey 2023 – Record Demand and Record Deficits just the beginning
News
|
Posted 28/04/2023
|
23911
The Silver Institute has just released their much anticipated World Silver Survey 2023 which covers the year 2022. As we reported earlier this year on initial estimates, 2022 did indeed break all records. Not only did 2022 set a record for demand, some 1.2billion oz (or 38,643 tonne) but falling supply also saw a record supply/demand deficit of 237.7million oz (7,393 tonne). Further, when combined with the 51.1m oz deficit in 2021, the combined surpluses of the preceding 11 years were wiped out in just 2 years, and they are forecasting continued deficits each and every year to beyond even their 5 year outlook. So let’s look at some summary highlights from the report…
First the obvious question, in a year where the average price fell by 14%, why didn’t the price reflect this demand and deficit? In essence, as with gold, the rising rates and tightening liquidity environment saw Wall St exit ETF’s and look for yielding alternatives. But as with gold, and as we discussed here, the global liquidity flows turned from tightening (removing liquidity) to easing (adding liquidity) around October and that is about when both metals decisively turned. Silver bottomed at US$18 and, despite the pull back last month, has generally been climbing to its current US$25, a 39% gain. Recall from the above link, that history tells us we are still in the bumpy bottoming phase and could expect 3 years of bull market for precious metals from here.
So let’s look under the hood at what happened to see these dual records broken.
Silver Demand
Overall, all sectors were up last year and, despite the fall in ETF’s, physical investment demand saw the biggest increase.


Investment Demand
Per above it was a year of 2 investors – those looking beyond the carry cost bought up physical metal at a record rate (up 22% to 332.9m oz) whilst those whose ‘computer’ said ‘high rates sell precious metals’ saw outflows from ETF’s at the fastest rate since 2011 (down 11%). That said, ETF holdings are still historically very high after the huge inflows we saw in 2020, so it is all relative.

The physical demand was absolutely dominated by India. Now officially the world’s most populous country, Indian investors can spot a bargain a mile away, love precious metals, and they pounced on the cheap silver against its strong fundamentals. The table below shows that Aussie investors, by percentage increase year on year were second placed behind India with 17.3m oz snapped up, something Ainslie has certainly witnessed with a record year as well.
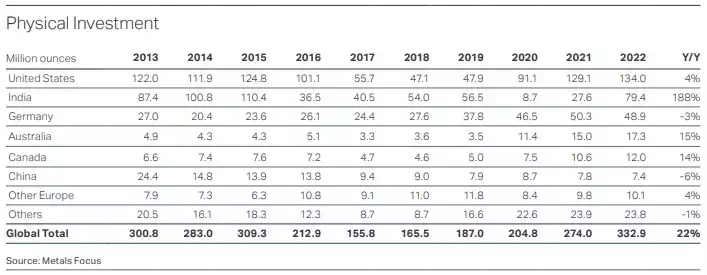
From the report: “One of the most notable features of last year’s silver market was India’s record imports of silver bullion, which surged by 244% to 306.6Moz (9,535t), as at times weak prices led to both a jump in demand and restocking of a depleted supply chain. This in turn underpinned the near doubling of UK exports, which also achieved a record total of 363Moz (11,302t) in 2022…… which saw London vault holdings drop to a reporting low.”
Industrial Demand
“Industrial silver fabrication increased by 5% in 2022 to a record high of 556.5Moz (17,309t). Electronics & electrical demand rose by 6% thanks to PV installations, power grid investment, automotive’s recovery and limited thrifting. Brazing alloys fell by 3% as losses in China [lockdowns] outweighed gains in most countries. Other industrial offtake grew by 7% due mainly to gains for EO catalysts.
Offtake is expected to grow by a further 4% to another high in 2023, with rising PV end-use again to the fore.”
As we reported last month “The UNSW research paper forecasts silver demand for solar panels alone will require over 20% of current supply (and supply is trending down) by 2027, double that currently. By 2050 photovoltaic demand will use 85-98% of current global silver reserves.”

Photographic Demand
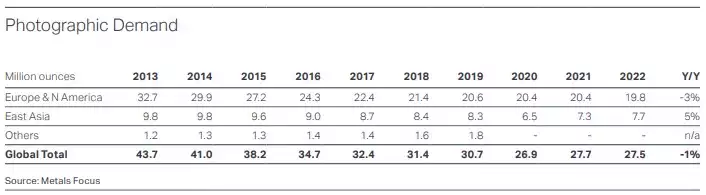
Whilst many think of photographic use as ‘gone’ it remains a significant and fairly stable number in the demand equation for silver.
“Silver demand in photographic applications remained broadly flat last year at 27.5Moz (855t). Sales of consumer and professional film and paper both edged higher, nearing their respective pre-pandemic levels, although these were already at historic lows. There are tentative signs that film photography is making a return, as a number of film makers not only revived some discontinued films last year, but also introduced new film stocks. Black and white film, which has higher silver loadings than color film, achieved solid gains. Indeed, demand overtook product availability, although this was in part caused by supply chain issues.”
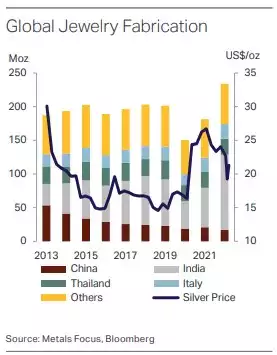
Jewellery & Silverware
“Global silver jewelry demand jumped by 29% in 2022 to a record 234.1Moz (7,280t). India drove the bulk of these gains, due to a rebound in consumption and restocking. The rest of the world was flat y/y as a post COVID recovery for most countries offset losses in China [lockdowns], Russia and the US…. Silverware fabrication in 2022 surged by 80%”

Silver Supply
Mine Supply
“Global silver mine supply fell by 0.6% y/y in 2022 to 822.4Moz (25,578t), largely due to a drop in Peruvian production”
Per the table below, Mexico remains dominantly the world’s biggest silver producer with Australia currently ranking 8th but experiencing the biggest percentage decline last year at 10% “largely due to planned lower tonnage throughput at South32’s Cannington while crushing infrastructure was relocated.”

As regular readers will know, silver supply is largely a bi-product of other mining, with (per the chart below) primary mine supply accounting for only 27.8%.

Silver Mining Cost
“Inflation in almost all key input costs last year drove primary silver miners’ all-in sustaining costs up by 15.8% y/y.” Per the chart below, this pushed costs above even the current US$25/oz spot price, putting further pressure on mine supply and that deficit.

As for the rest, well, that’s a little more complicated. From the report:
“Most silver mines are polymetallic in nature and produce significant amounts of lead, zinc, gold and/or other metals. Revenue generated from these metals lowers cash costs as by-product credits. In 2022, zinc prices increased by 15.6% y/y, while gold remained almost flat and copper and lead prices fell by 5.5% and 2.5% respectively. The higher zinc price pushed by-product credits from zinc higher, while increased gold production from these miners pushed revenues from gold up. These increases surpassed lower revenues from lead”

Silver Recycling
“Silver recycling grew by 3% in 2022 to a 10-year high of 180.6Moz (5,618t). The key driver was the 7% rise in industrial scrap, mostly driven by the recycling of spent EO catalysts. Jewelry, silverware and coin scrap in contrast were almost unchanged, while photography’s structural slide continued.”

Finally, if you missed our article a couple of weeks ago on the pricing fundamentals looking forward for silver it is well worth a read. Structural deficits in supply and multiple coinciding drivers of demand look to bode well for the white metal.