Why U.S. NFP Hit on Gold & Silver Prices Won’t Last
News
|
Posted 10/06/2024
|
2869
Gold (-3.5%) and particularly silver (-6.8%) prices got smashed on Friday night (Australian time) off the back of a big surprise in the U.S. employment NFP numbers. Huge web orders and CoinSpot Gold & Silver Standard sales over the weekend indicate many people are reading the play here (and loading up on the dip) but let’s spell that out.
Firstly, that NFP data was a load of conflicting rubbish. Yes, the headline number employed was way above even the most aggressive estimate, printing 272,000 new jobs vs 180,000 consensus and up from the (as usual) downward revised 165,000 from April. However, a look behind the headline saw the unemployment rate actually go UP to 4% and ALL of the jobs gained were their mythical “birth/death adjustment” (231K!) and part time foreign workers. Indeed, the widely considered more accurate Household Survey saw a 408,000 drop. Full time workers fell 625,000 and part timers surged by 286,000 to an all-time record 28 million. You can’t make this rubbish up. Regardless, the market reacted on the headline only, everything is awesome, so the Fed will not cut rates, but we love low rates, so sell everything and buy USD. And of course, we don’t need gold and silver because everything is now awesome.
This is all short-term noise dwarfed by the U.S.’s real problem of massive debt overhang and deteriorating demographics. Both the government and Fed have no choice but to loosen monetary policy and add liquidity as they need to service that debt through monetisation as Mr & Mrs U.S. Citizen can simply not pay for it. U.S. debt to GDP is nearly 124%.
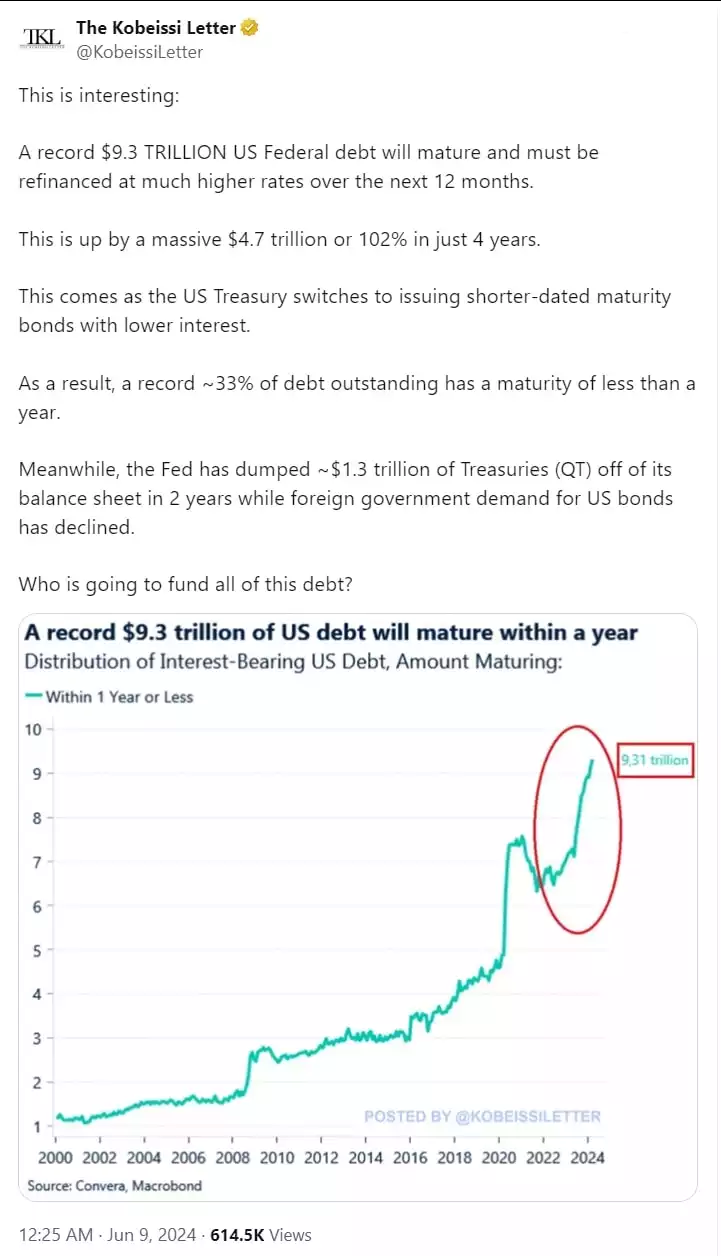
To be clear, they have $9.3 trillion of debt maturing in just the next year!

Again as a reminder of how this happened… From Global Markets Investor:
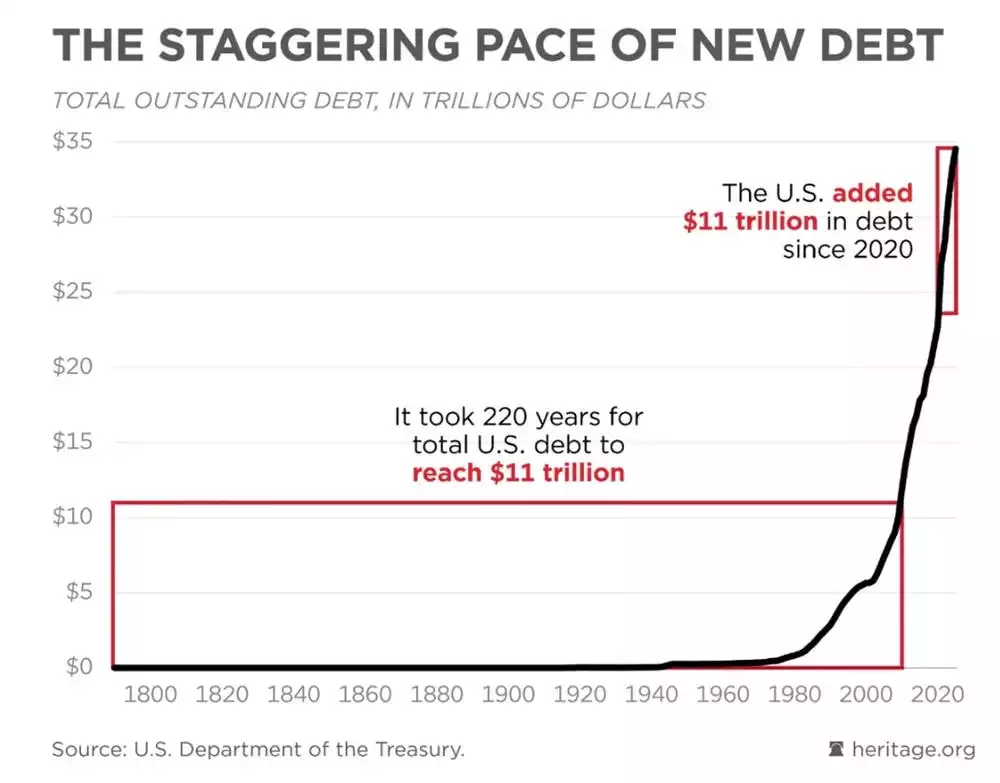
“In the last 4 years, the U.S. national debt has skyrocketed by a whopping $11 trillion. This is the size of 40% of the U.S. economy’s GDP. By comparison, to reach the first $11 trillion of debt for the U.S. it took 220 years.”

“It means that on average national debt has increased by $2.75 trillion a year. Since June 2023, the U.S. federal debt has increased by $3.1 trillion and hit a record $34.6 trillion. In other words, it has been increasing by roughly $1 trillion every 100 days.”
Michael Howell of Cross Border Capital recently laid it out simply and looks beyond just the U.S. There is around US$350 trillion of debt in the world and it on average needs refinancing around every 5 years. So that is around US$70 trillion every year. For (very important) context, global GDP is around US$120 trillion. So, debt sits at 290% of GDP and 58% of global GDP is required JUST to deal with past debt, before considering the rampant amount of new debt being generated through fiscal deficits AND servicing the past debt. And that is why he makes the analogy of your home loan. If you have to refinance your home loan you don’t ‘care’ about what the rate is, because your alternative is homelessness. Likewise, it is not rates that determine the capacity of governments, central banks and the finance sector to roll all that debt over, it’s balance sheet capacity. By definition, in a world spending more than it’s making, with rapidly deteriorating demographics, that will be via accommodative monetary policy… Printers go brrrrrrr.
Global Liquidity, after its April airpocket, is returning, and history would indicate that is very constructive for gold and silver. The BLS will almost certainly, but very quietly, revise lower that 272K NFP number next month, but no one can reverse the out-of-control accumulation of debt and the reality of servicing it.