Why Silver Looks Set to Rocket Higher
News
|
Posted 30/03/2023
|
15628
History tells us that as gold rallies into a bull market, silver (usually coming off a lower low) rockets past gold to outperform (to a higher high). Welcome to the leveraged ride that is silver. Newcomers to precious metals, looking at gold now given the market fundamentals behind this rally, often overlook or don’t understand the silver market. Let’s have a look at where we are.
Firstly, a reminder that silver wears 2 hats; monetary metal and industrial commodity. The former is in line with gold and the latter is more exciting than most commodities given the key uses are growing sectors like renewable energy and electronics. We wrote to the solar demand equation recently here, and TLDR, it’s exploding and silver, in a deficit (demand outstripping supply) not just last year, is projected to remain in deficit by over 100 million oz per year for the next 5 years at least. The NSWU study it discusses projects solar demand alone will equate to 98% of supply by 2050. It’s an article well worth reading. Silver had a hard time of it from 2013 to 2020, and the chart below is a salient reminder of the impacts of supply surpluses and more importantly looking forward the impact of deficits…

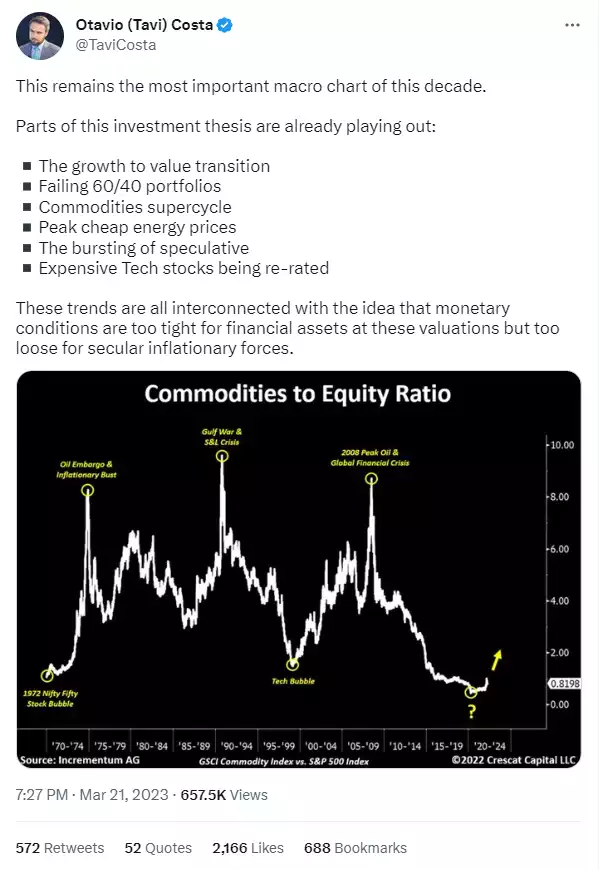
Before we leave the industrial use driver, it is timely to remind ourselves just where commodities sit relative to shares as we exit the liquidity tightening phase into the liquidity easing phase that is usually very constructive for commodities in general.
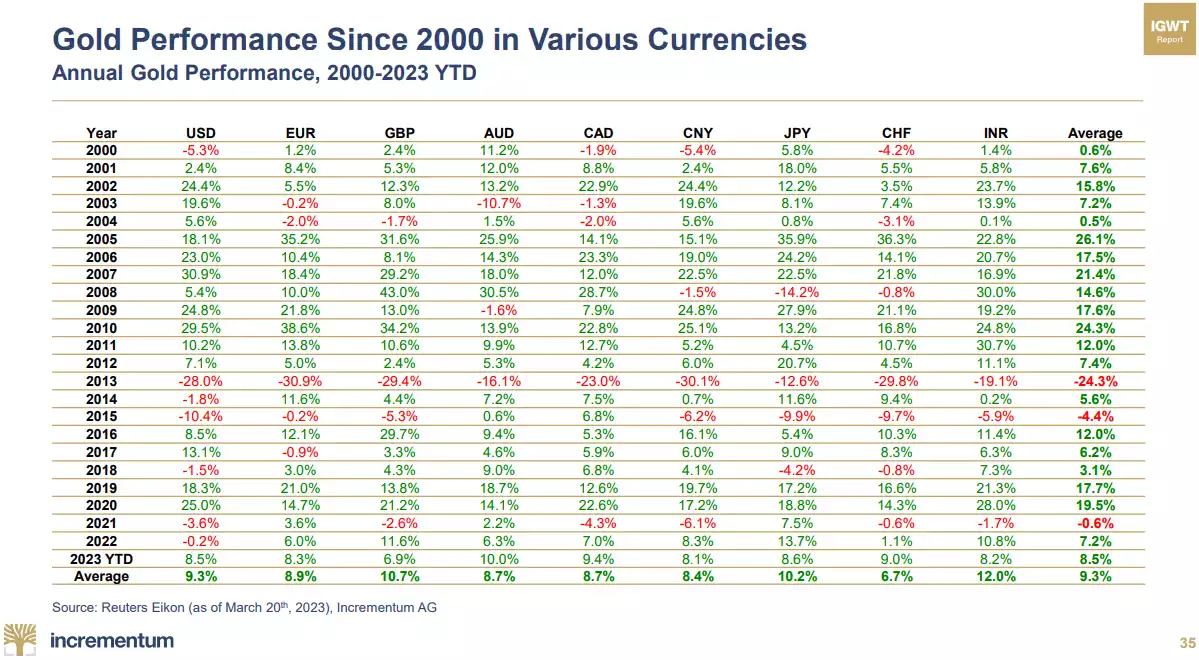
Last week we presented a chart filled summary of the In Gold We Trust report preview. It included some enticing charts around the prospects for silver. One chart included the Gold:Silver Ratio (GSR) which regular readers will know is still at historic highs but starting to fall as usually happens in a gold rally. In 2011 when silver hit $50, the GSR was just 30:1, a 283% difference to its current 85:1!! However, let’s not forget that kind of variation implicitly means silver is more volatile than gold. The following tables from the In Gold We Trust preview paint a very clear data story. Note as you compare the amount of red in the silver one compared to gold. However, note that silver has, on average performed significantly better than gold since the turn of the century; 49% better. In other words, buying at the right time, or holding for a longer time, can see silver significantly outperform gold and more than counter the higher percentage premium above spot that silver must wear by virtue of production, transport and storage costs of the heavier metal.

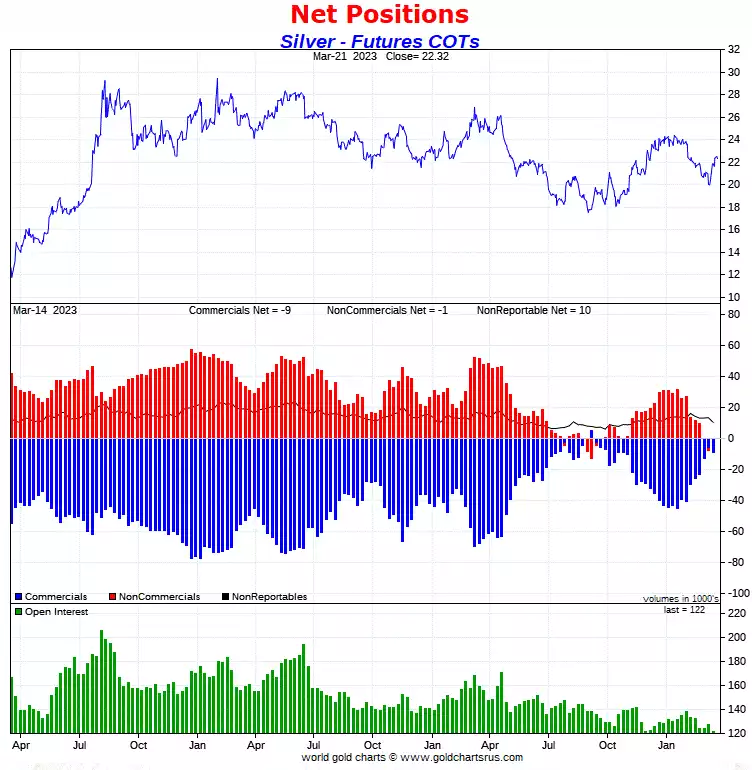
And for those who think silver is manipulated on COMEX futures… check out this for one beautiful Commitment of Traders report from the CFTC!
But finally, don’t take out word for it. Citi just released this note to clients:
“Time to ride the silver bull… We had already held the view that at some point over the next 12 months the silver market was going to start to price a Fed easing cycle. Alongside a recovering China, and likely related USD weakness (our economists forecast 96 DXY by year-end), this would be very bullish silver. We believe that the issues with regards to the small/regional US banking system may bring the silver bull market forward and so we would not wait any longer. Whether it happens sooner or later, at some point before year-end, we are increasingly likely to see events develop similar to that which occurred during 2H07/1H08, during which silver rallied ~75% and precious metals rallied ~50% (i.e. Fed cuts, solid China). Further, we see silver outperforming gold over the next 6-12 months owing to its general leverage to precious metals bull markets, but also its higher exposure to a recovering China, solidly growing India, and its exposure to solar-related consumption growth (the latest technology uses 3x silver). Specifically, we can see the gold/silver ratio revert towards its mean of 70 from the current levels of ~90. Our 0-3 month forecast is now $24/oz (up from $22/oz) and our 6-12 month forecast is now $28/oz (up from $25/oz). In our bull case scenario, silver could reach $34/oz by year-end (~48% return).”
Their GSR mean is curiously high, but like all means it depends on the sample length. We usually talk to a 45 mean being an approximation over the last century. The In Gold We Trust guys talk to a median of 30.4 but take that back to 1800 which includes protracted periods fixed at around 15. Regardless, at the 85:1 today and even Citi’s short term 70:1, with the 120:1 reached a couple of years ago, the bottom on the other side of the mean could still be in the order of 20:1. On gold’s current AUD2,940/oz (and don’t forget gold rises in a falling GSR in unison), we’d be looking at silver in todays terms at AUD147/oz, a 321% increase from the current AUD34.90… Relative volatility can be good… very good. Add that silver is a hedge within a hedge (as it has 2 drivers not 1), it presents a better diversification case as well.