What US Profits are Telling Us Right Now
News
|
Posted 26/04/2019
|
8087
Wall St hit another new high earlier this week amid poor economic data and more signs of slowing global growth. Indeed a key global economic health indicator is how South Korea is fairing. It just printed a surprise 0.3% negative GDP, the second only and largest since the GFC which was the only since the Dot.com fall out. Quite a correlation…
So is the US sharemarket rally real or based on irrational exuberance? Again, lets go back to basics. Investing in shares is investing in how a company is, and more importantly is going to, perform and grow. The measure of that ultimately is profit. Those companies are a major contributor to the economic growth of the country in which they operate, and that is normally measured by GDP. In that context, Lance Armstrong of Real Investment Advice maps out this equation in the following charts.
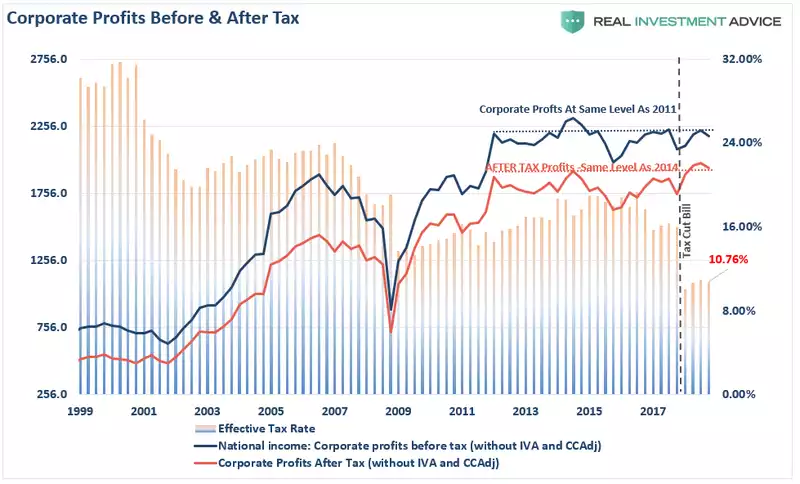
Firstly, lets look plainly at profit growth:

As you can see, against share prices hitting all time highs, corporate profits remain at the same level as they were in 2011 on a pre-tax basis, and 2014 on a post tax basis.
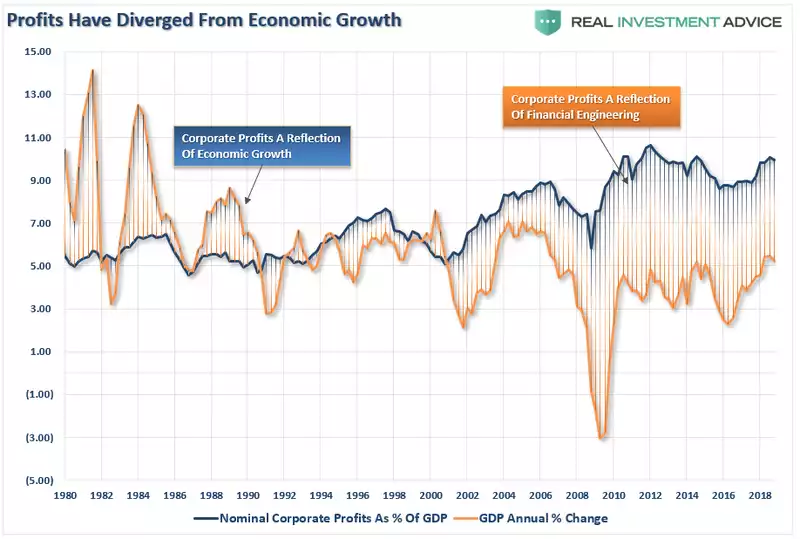
But what about in the context of broader economic growth via GDP you rightly ask?

In a trend since the start of this century you can see that profits have been outpacing GDP. This has jumped considerably off the back of all the central bank monetary stimulus post GFC but you can see we are no higher now than 2011 despite tax cuts, over $1 trillion per year deficit spending and of course that rampant sharemarket.
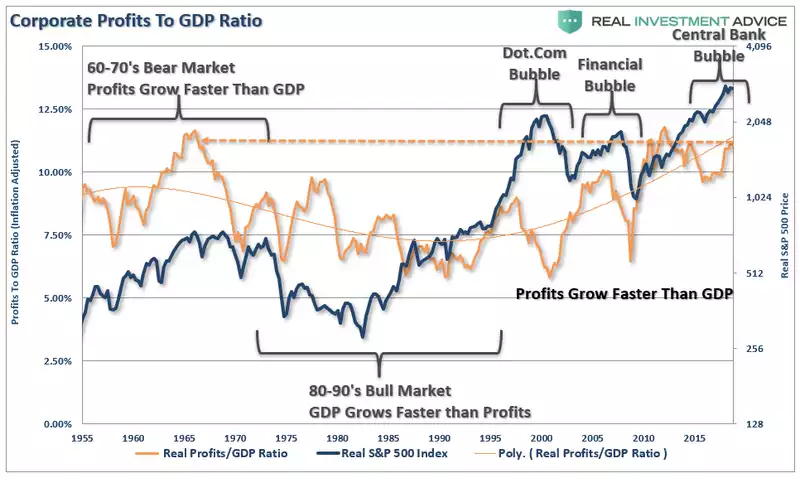
Armstrong then puts more context around this by looking back at the previous bull and bear markets.
“Looking at this a little differently, we can better understand what is occurring. In the 60-70’s, leading up to the “Black Bear Market of 1974,” corporate profits were growing faster than GDP. This is ultimately an unsustainable trend as profits are a function of economic growth and not the reverse. The 80-90’s bull market was a period of economic growth outstripping profit growth as interest rates and inflation fell. Beginning at the turn of the century, and now three asset bubbles later, profits are again growing faster than the economy.”

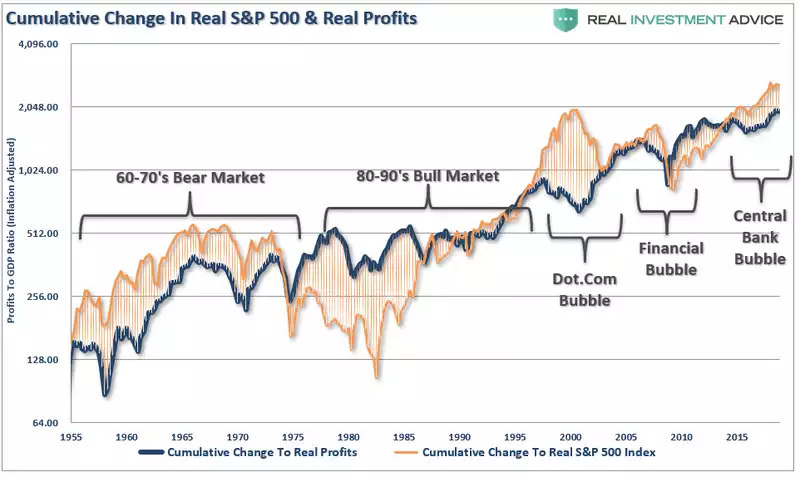
“The same can be seen in the cumulative change in asset prices versus profits. When price inflation exceeds profit growth, that deviation has not historically lasted very long.”

Yet still markets seem to think ‘this time is different’ and indeed recent sentiment data has participants as bullish that the Fed Put will always be there and Trump will pull a China trade deal out of the hat this year. Roberts, however, doesn’t agree:
“The expectation of an economic recovery to support the continuation of the bull market is likely misplaced for several reasons.
- The Fed rate hikes that were done in 2018 are still working their way through the economy, Higher rates are impacting economically sensitive sectors like autos, housing, and manufacturing.
- Economic growth globally remains weak and is impacting growth in the U.S.
- Interest rates, and the yield curve, despite stocks hitting “all-time” highs are suggesting that economic weakness is likely more pervasive than currently believed.
- The rising trend of the U.S. dollar will impact exports which makes up between 40-50% corporate profits.
- Imports continue to suggest the U.S. consumer, 70% of the economy, is weaker than headlines suggest.
- Rising oil prices, and gasoline prices, are a tax on consumers and will further impair economic growth.
- Deflation is a rising concern.
- There is no massive slate of natural disasters to pull forward consumption or boost manufacturing, construction or commodity demand.
- While deficit spending is certainly supportive of growth, with the deficit already at $1.2 trillion, the rate of change in deficit spending will not be supportive of stronger economic growth.”
The length of broader bull and bear market cycles means we may well have some good gains left in the current sharemarket bull run, already the longest of the S&P500 in history. However the lessons of these broader cycles are equally clear and probably best articulated by John Hussman as follows:
“Regardless of very short-term market direction, it is urgent for investors to understand where the equity markets are positioned in the context of the full market cycle. While the most extreme overvalued, overbought, overbullish, rising-yield syndrome we define has generally appeared only at the most wicked market peaks in history, and investors have ignored those conditions over the past year. We can’t be certain when the deferred consequences will emerge. But a century of market history provides strong reason to believe that any intervening gains will be wiped out in spades.
It’s instructive that the 2000-2002 decline wiped out the entire total return of the S&P 500 – in excess of Treasury bills – all the way back to May 1996, while the 2007-2009 decline wiped out the entire excess return of the S&P 500 all the way back to June 1995. Overconfidence and overvaluation always extract a terrible payback.”
We often remind readers of some basic math in this regard. Stay in the market and exit at exactly the right time and you may get that remaining 10 or even 20% gain left in it. Miss that exit point (likely in the middle of the Aussie night as the US craters), lose 50%, and you have to make 100% on what’s left just to get back to where you started.