What US$40 Trillion in Debt Means for Silver
News
|
Posted 09/09/2026
|
2208
Key Takeaways
- US federal debt passed US$40 trillion in August 2026 and keeps compounding.
- Rising long dated yields alongside a weakening dollar has historically favoured metals.
- Silver's case rests on the gold-silver ratio compressing toward its long run average.
The debt backdrop
With the US National debt recently ticking over the eye watering 40 trillion dollar mark on 19 August 2026 (Al Jazeera) and US dollar strength being inversely correlated to the US government debt levels (the more debt that is needed to be serviced, the more US dollars that are needed to effectively be brought into circulation), the current parabolic trajectory of US debt paints a bleak picture looking forward of high inflation, lower US bond values and high interest rates in an environment where precious metals could be well positioned.
As the US dollar devalues in an inflationary regime, bond yields are held high, preventing the Fed from being able to cut interest rates without destabilising the bond market. The 30-year Treasury yield sat at 5.25% on 8 September 2026, its highest since 2007 (Trading Economics).
The 1950 to 1980 precedent
This rising interest rate, rising bond yield environment is reminiscent of 1950-1980 where gold and silver went on parabolic runs, with the gold-silver ratio ranging from 20-40 (Cedar Gold Group).
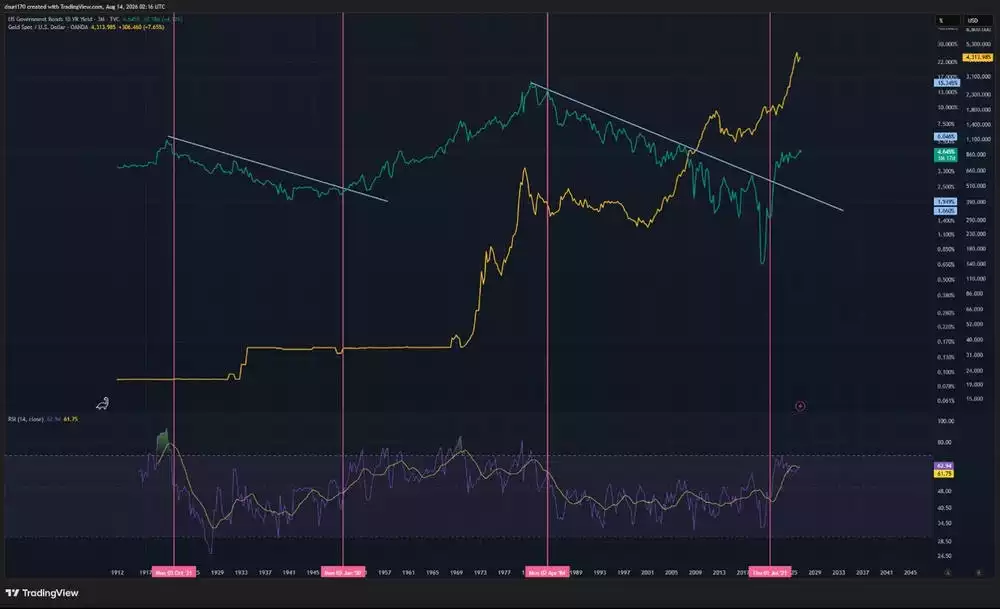
Below we see long dated bond yields in green overlaid on the gold price. After decades of falling bond yields and the RSI below 50 we see a definitive trend break in the yields with the RSI holding above 50, showing a potential change in regime as seen after WWII.
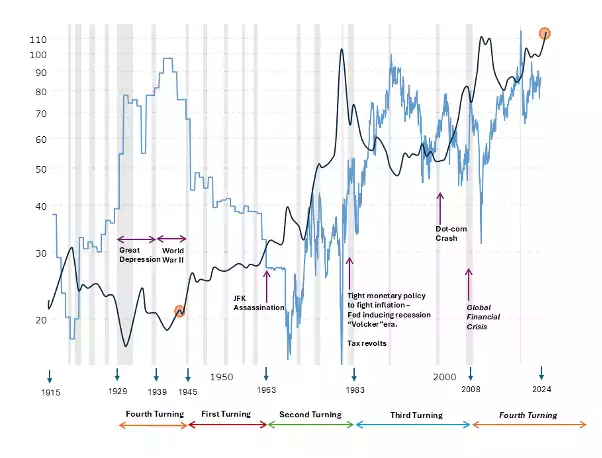
This post WWII phase is referred to socio-economically as "the first turning" of a macro 80 year cycle, the Strauss-Howe framework, one which we are currently on the precipice of, with the current "fourth turning" reaching fruition (The Fourth Turning Is Here, 2023).
We see on the chart below the first and second turnings witnessed multi decade bullruns for silver (dark blue) with the GSR (light blue) being held low.
Pricing gold off the debt
Finally, with the US national debt being the central point around the high inflation, high yield, high interest rate regime we are entering, we can use the US debt-to-gold ratio to project a price for gold in US dollars with national debt projections.
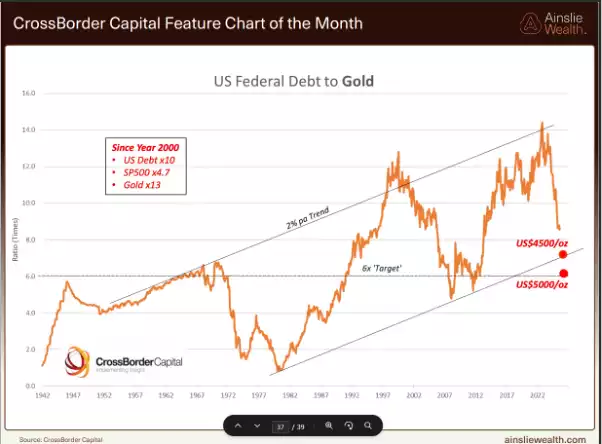
With the US$4,500/oz target for gold having been hit already, gold having first cleared that level in late December 2025 (South China Morning Post) with AUD gold bid around A$6,100/oz in early September 2026 (Australian Gold Capital), projecting the US government debt out 15 years in line with these metrics provides a target of US$25,000/oz, with gold essentially acting as a barometer for US national debt, moving inversely to the purchasing power of the dollar.
With the 100 year average gold to silver ratio of 50, this gives us US$500 for silver (BullionStar), roughly A$700/oz in today's terms at the RBA's 8 September 2026 rate of A$1 = US$0.7218 (RBA).
While the US debt increase is parabolic rather than linear and the historical precedent for the gold to silver ratio is sub 50 in such regimes, it would be reasonable to see these timelines shorten. The counter-case is that the ratio has spent much of the past three decades well above 50, averaging closer to 70 through the 2000s, and silver's industrial demand base cuts both ways: it lifts the metal through an expansion and drags on it in a recession. Ainslie Bullion has been helping Australians hold physical gold and silver since 1974, and clients working to a thesis this long dated tend to accumulate through the cycle rather than time a single entry.
This article is general information only and does not constitute financial advice. Past performance is not indicative of future results. Always conduct your own research or consult a licensed financial adviser before making investment decisions.