What History Tells Us About Gold’s Sharp Moves
News
|
Posted 23/10/2025
|
2002
After a stellar run this year, gold has surged 67% from its January low of $2,614 to a high of $4,381. While it's currently trading at $4,103, that's still a 57% gain year to date. So while some buyers may be unsettled by the recent dip, it’s worth pausing to remember why you bought precious metals in the first place—and asking yourself, has anything really changed?
In fact, as of Monday’s drop, there have only been five days this financial year where you’d be sitting on a loss from your gold and silver purchases.
Monday’s Drop in Context
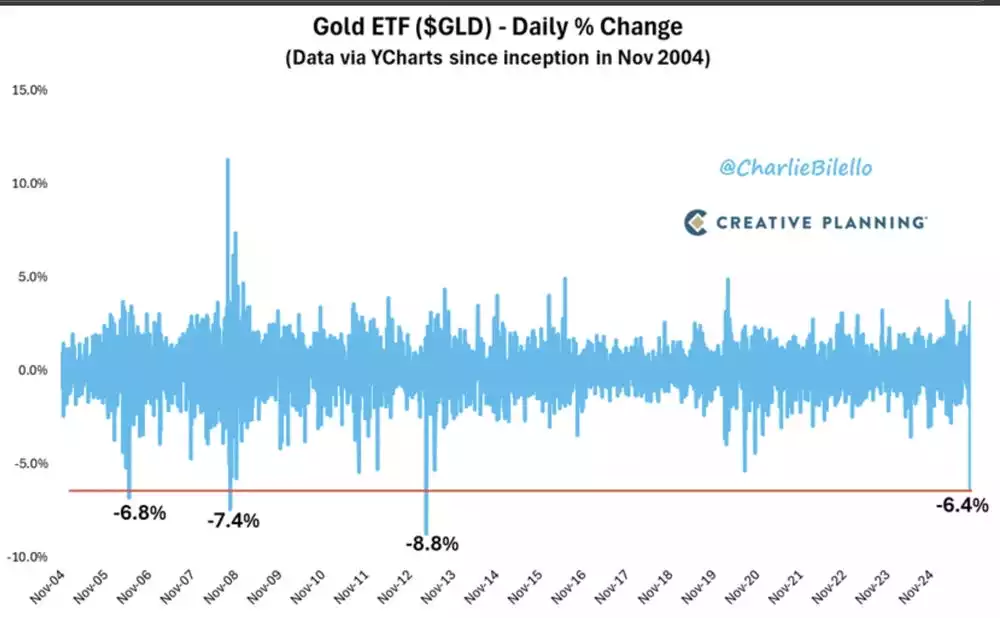
Monday’s fall in gold was one of the steepest in recent memory—only surpassed three times in the last two decades, with the COVID crash close behind. Aside from 2012, each of those major declines was followed by sustained rallies, as gold fulfilled its role as a safe haven during periods of uncertainty.
A Familiar Pattern
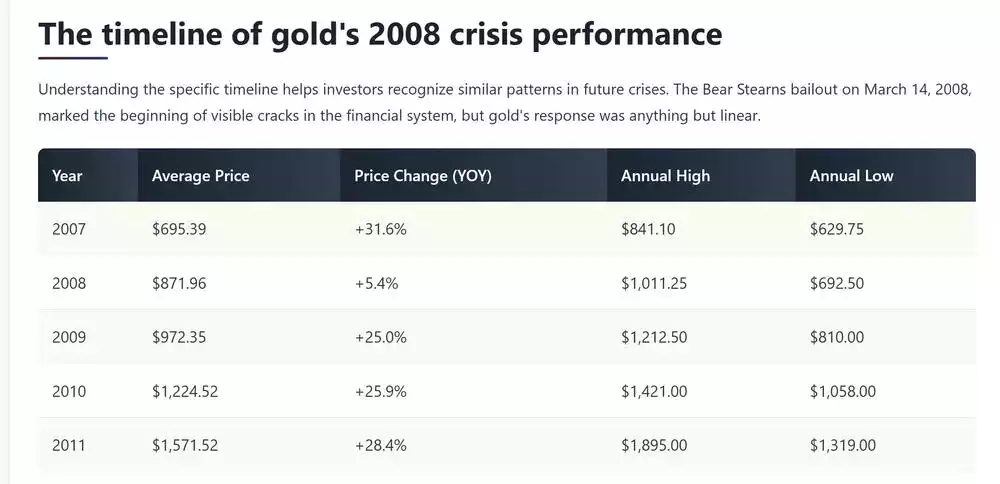
History is often a reliable guide. The current asset bubbles echo 2007—only larger—and gold’s performance is reflecting that. Back then, gold rose 31.6% in the lead-up to the GFC as markets overheated and investors piled in using leverage. But it was the cautious few who began to see cracks and moved to gold that benefited most.
In early 2008, when Bear Stearns collapsed, gold dropped sharply—around 7.4% in a single day—as investors sold high-performing assets to cover losses elsewhere. This is a classic example of the disposition effect: liquidating winners to offset losing positions in equities and real estate.
Just as the gains in recent months have been significant, so too will be the pullbacks. Volatility is a feature, not a flaw, of major moves.
After the Storm, the Surge
It was after the GFC truly took hold that gold delivered its most consistent gains—up nearly 30% per year for three consecutive years. If the current market mirrors 2007–2008, the rally may only just be getting started.
Much like during the 2008 crisis, we’re again seeing a divergence between spot prices and physical bullion. Back then, the falling paper price masked growing demand for physical metals, sending premiums sharply higher. It took more than six months for the market to realign.
Today, we’re seeing a similar setup: leasing rates are spiking across metals—especially silver and platinum—and the gap between physical and paper markets is widening. Expect premiums to remain elevated as volatility persists.
What Now?
Rather than a cause for concern, Monday’s drop could mark a flush-out of weaker hands in the paper market, and a widening disconnect from physical demand. If this is just the beginning, supply pressure is likely to intensify.
So again, ask yourself: has anything really changed? Or is this the very environment that justified your move into bullion in the first place?
Watch the Insights video inspired by this article here: https://www.youtube.com/watch?v=zojexF0hHak&list=PLXTQN9szMoMXLSthU5QZiFQKczA8-ElQS