Weak to strong in 2 graphs
News
|
Posted 27/04/2015
|
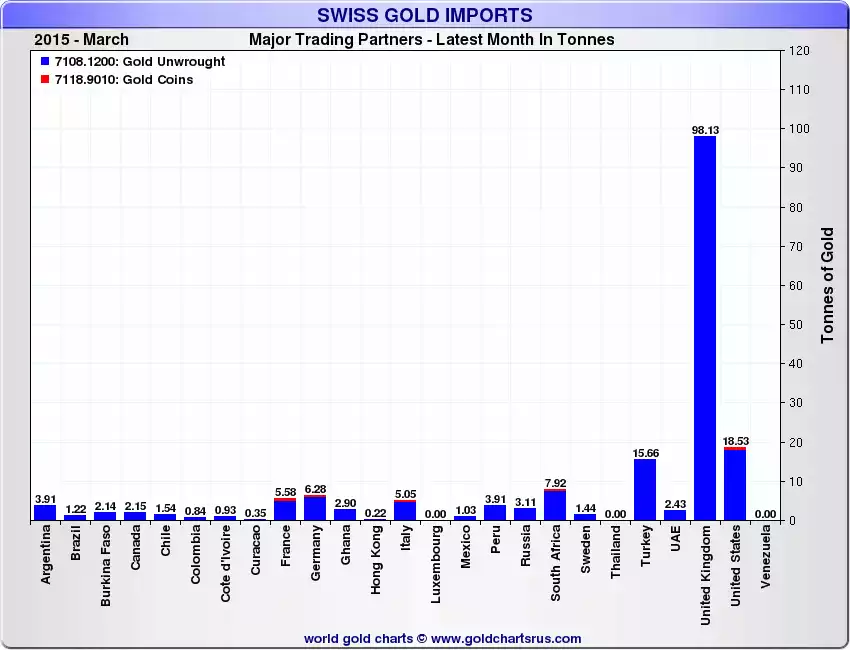
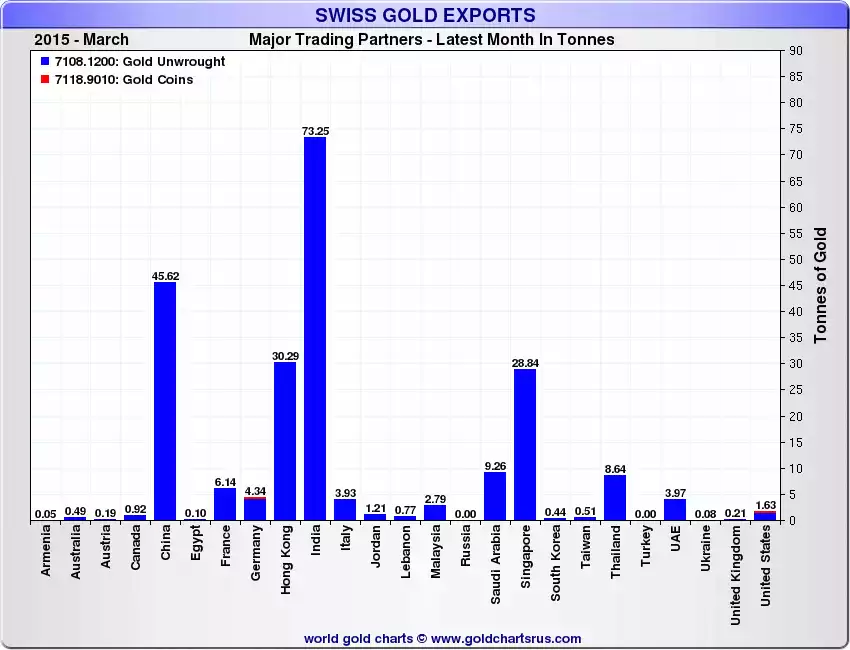
5900
Long time readers will be all too familiar with our weak (speculative Western ‘paper gold’ investors) to strong (long term Eastern strategic holders of physical gold) narrative of what has occurred over the last few years. In 2013, the year of the biggest price rout in 30 years, we saw over 900t of gold leave London’s vaults for Eastern consumers, a lot of that via Swiss refiners turning the big 400oz LBMA bars into the East’s preferred 1kg bars. ETF’s and Futures prices crashed the market and the East just hoovered it all up and have not stopped since. According to Swiss Federal Customs in March 2015, gold exports to China almost doubled (at 46t – but in reality 76t when you add that via Hong Kong), the most since data started, and India also more than doubled to 72.5t whilst imports into Switzerland climbed sixfold. The Swiss refineries are the world’s biggest and are a good barometer of movement. London is where most ETF’s and Futures holdings are kept. The graphs below tell the story and again we must include the cartoon that sums it up. The West are buying in to over inflated shares and bonds, whilst the East see this for the Ponzi Scheme it is and are buying the world’s safest hard asset.


