WGC Gold Demand Trends Q3 2018
News
|
Posted 02/11/2018
|
8607
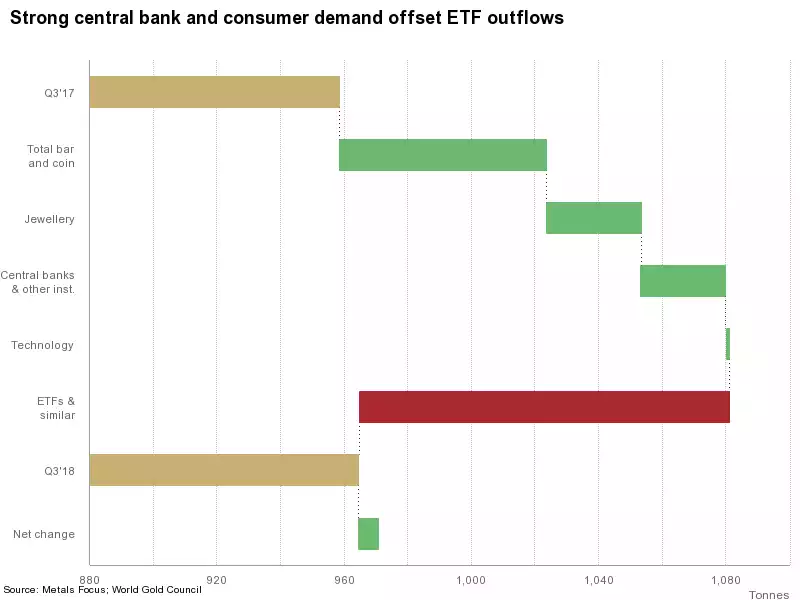
Yesterday saw the release of World Gold Council’s quarterly demand trend update report with steady demand, up 6.2 tonne year on year, but big moves under that net figure. Here is a summary:

Investment - Physical
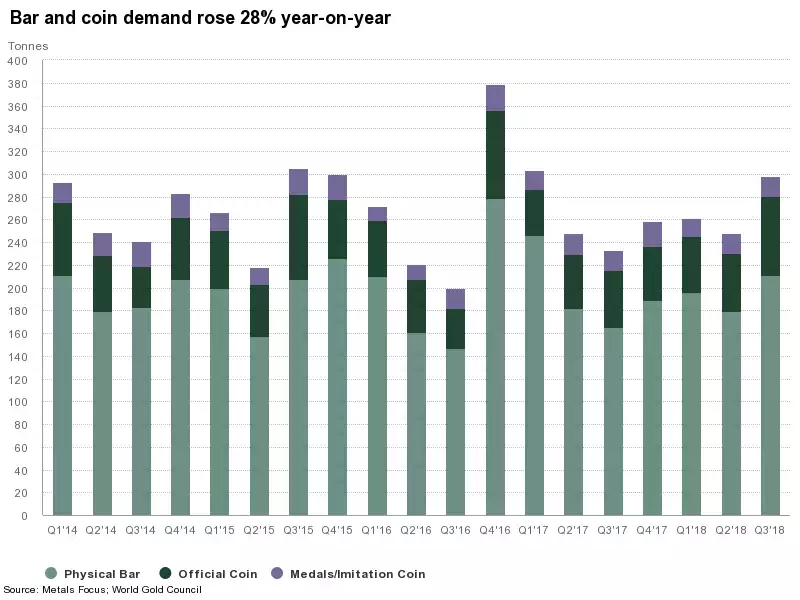
Bar and coin investors took advantage of the price dip; demand rose 28% y-o-y. Stock market volatility and currency weakness also boosted demand in many emerging markets. China – the world’s largest bar and coin market – saw demand rise 25% y-o-y. Iranian demand hit a five-and-a-half year high. The graph below shows the history and breakup by product:

Investment - ETF’s
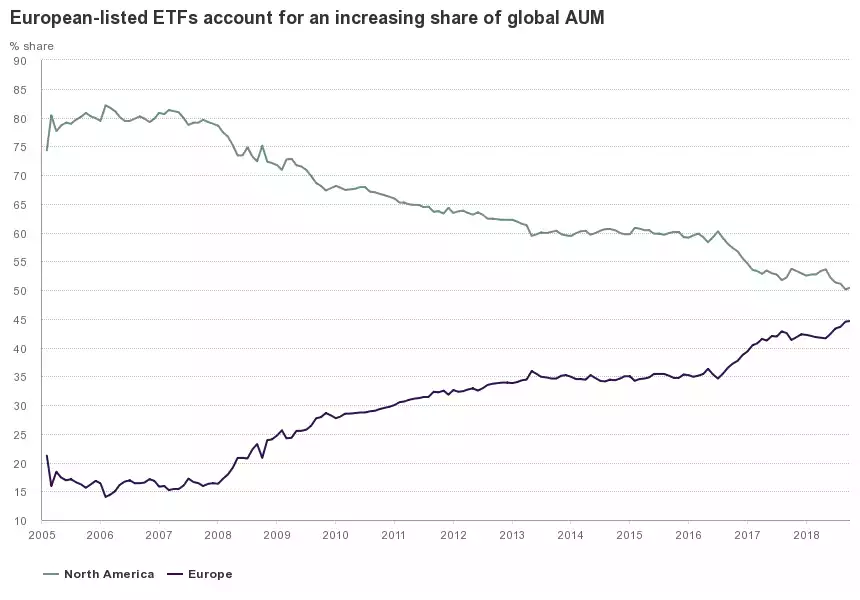
In stark contrast ETFs shed 103.2t in Q3. ETFs saw a 116t decline when compared with inflows of 13.2t in Q3 ’17, experiencing the first quarter of outflows since Q4 2016. North America accounted for 73% of outflows, fuelled by risk-on sentiment, the strong dollar and price-driven momentum. Notably this was all before the pronounced risk-off period we just experienced over the last 2 weeks of October. That predominance of US divestment compared to the ‘rest of the world’ again reflects that 2 speed market at present. It will be very interesting to see the Q4 figures. To put that 73% (or 75 tonne) into context, the US is solely responsible for almost 90% of outflows over the course of the year so far. Indeed we are getting very close to Europe equalling North America in share of gold ETFs:

Jewellery
Q3 jewellery demand saw price-led y-o-y growth of 6%. Lower gold prices during July and August encouraged bargain hunting amongst price-sensitive consumers. Growth in India and China outweighed weakness in the Middle East.
Central Banks
Central bank gold reserves grew 148.4t in Q3, up 22% y-o-y. This is the highest level of net purchases since 2015, both quarterly and y-t-d, and notable due to a greater number of buyers. If you missed it, we wrote of this recently here.
Industrial
Demand for gold in technological applications rose in Q3 by 1% y-o-y, to 85.3t. This marks the eighth consecutive quarter of growth, primarily driven by gold’s use in electronics such as smartphones, servers and automotive vehicles.
Supply
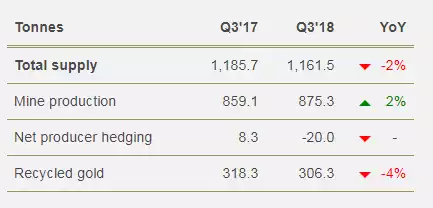
Overall, supply dropped 2% y-o-y broken down as follows:
- Record quarterly mine production of 875.3t in Q3, up 1.9% y-o-y
- Second consecutive quarter of significant de-hedging; the global hedgebook fell to 197t in Q3
- Supply from recycling fell 4% y-o-y; lower gold prices discouraged consumers from selling
