Using Currencies to Predict Gold & Silver
News
|
Posted 02/08/2024
|
2032
Gold just finished its highest ever daily close in Australian Dollars. This means analysing the gold chart can seem difficult, as it is open air above. Will it rise or have a dip, and if so, when and by how much? We know there are no guarantees, but there are places we can look for hints.
AUD/USD - Sign of Continued Gold Rise
Let's start with the major recent developments. The Bank of England announced an interest rate cut of 0.25% to the current 5% mark, ending one of the longest periods of heightened interest rates. This comes as the Federal Reserve just stoked hopes of a rate cut next month, and Australian inflation readings hinted that we are in a similar boat of inflation being where the RBA wants it. This news has already led to a weakening of these currencies in relation to gold.
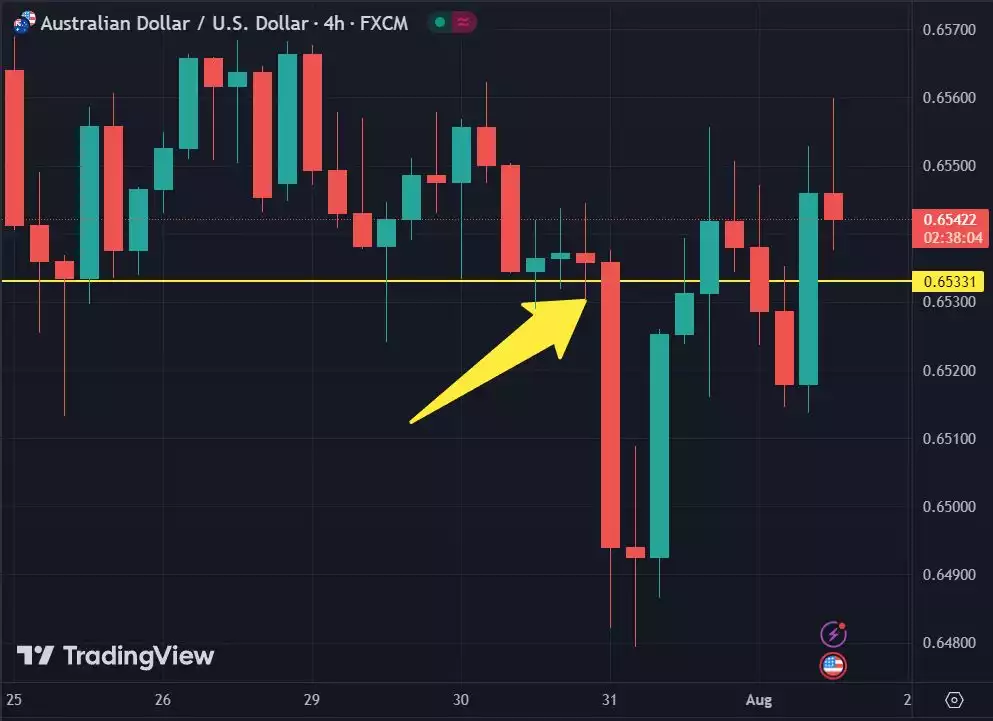
The currency pairs themselves have support and resistance levels which can tell us more than what the gold chart can. For example, here is the time that Australian CPI data came out and caused the Aussie Dollar to be pummelled. Some spectators are focused on the drop in price, followed by a recovery, then they are back where they started and have no clues as to what may happen next. Focus on the yellow line below. This is a strong support level that was broken by the CPI announcement. Notice that even after recovery, it fell below the yellow line again. This is indicative of a further fall in the Australian currency, and therefore a further potential rise in gold.

What Does the Yen Know About Gold?
Japan is understandably one of the major economic powers looking be an outlier and repair the immense devaluation their currency has already suffered in the last couple years. The Bank of Japan has recently made it clear that they are taking a path of re-strengthening the Yen. So, what could this mean for other currencies and gold? One fun fact that professional forex traders know is that USD/JPY (trading Japanese Yen priced in in U.S. Dollars) has been traditionally seen as a hedge against gold, or as an indicator to its next potential movements. The re-strengthening of the Yen could rekindle its status as a safe haven currency and re-enable the traditional dynamics between the Yen, the US Dollar, and gold.
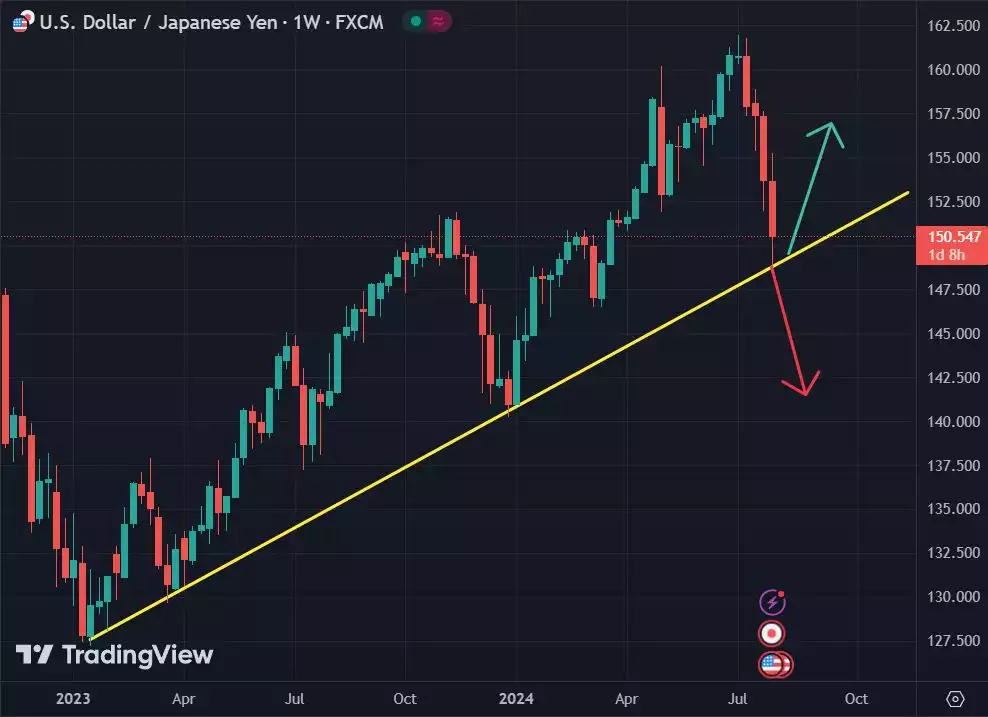
Traditionally, and as we can see again recently, USD/JPY and gold move in opposite directions. The chart below shows USD/JPY suffering a sharp fall recently and testing a trend line. This coincides with stronger gold prices. If USD/JPY falls through the floor (the yellow trend line), then this could be another sign that the price of gold could increase further.

Tonight at 10:30PM (Mel, Syd, Bris) the Nonfarm Payroll numbers will be released. This is the employment increase or decrease that happened in the U.S. last month. This announcement is one of the most traded events. If the data comes out above or below expectations, traders often scramble to adjust their positions, thereby causing violent price swings on the U.S. Dollar and gold.