Unshakable Confidence In Digital Assets Market
News
|
Posted 04/04/2023
|
10474
Recent Crypto Market Developments
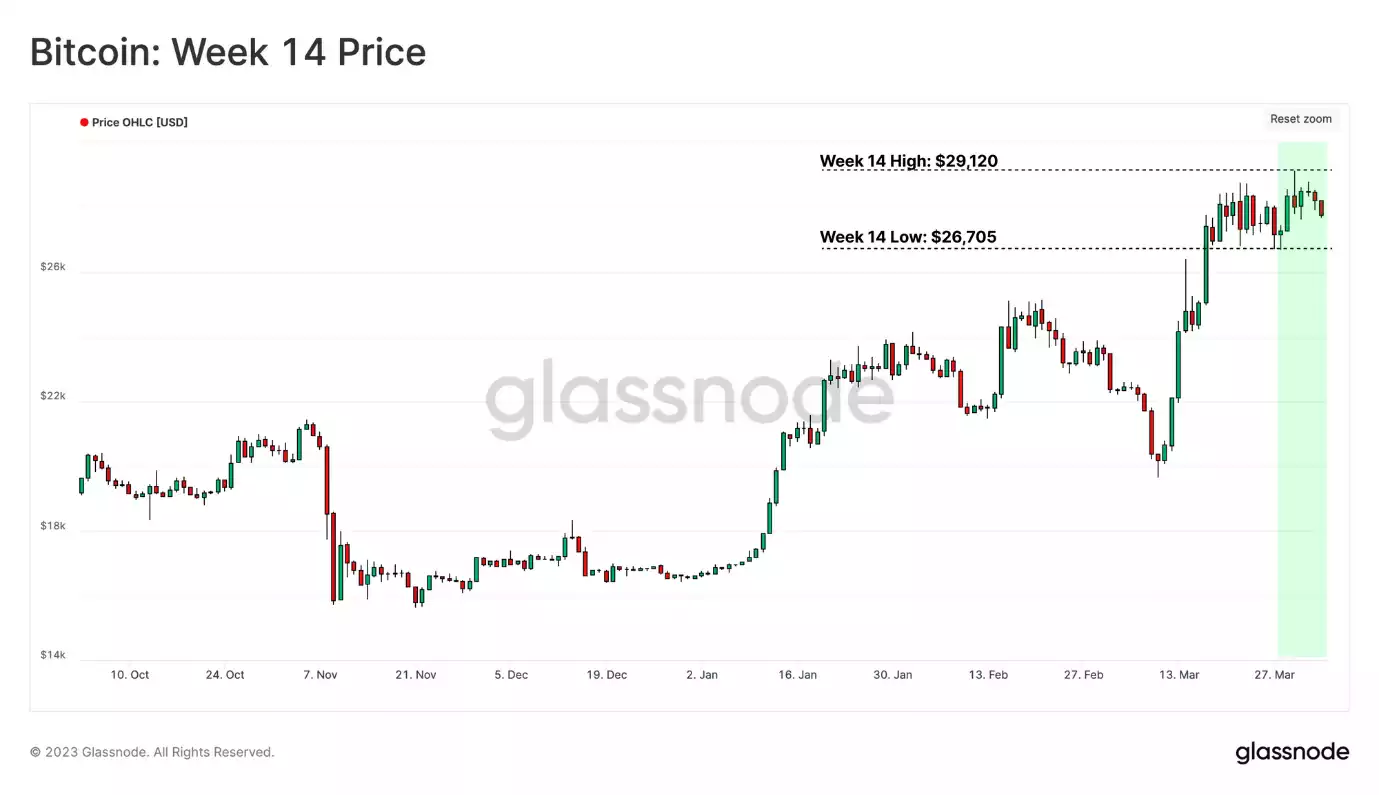
The digital asset market has consolidated within a narrow price range, reaching a multi-month high of US$29.1k. Despite persistent regulatory pressure, including a recent CFTC complaint against Binance and CEO CZ, the market appears resilient. Let’s examine the digital asset holder's response to the Binance regulatory news, potential shifts in token reserves, and the wider Bitcoin investor response. Furthermore, let's look at supply dynamics and coin movements between holders.
Market Boundaries and Recovery Patterns
Bitcoin's spot price is currently trading above its Realised Price (US$19.78k). The market is in a macro-transitional phase. Two pricing models act as boundaries:
- Lower bound: Realised Price ($19.8k) – average on-chain acquisition price
- Upper bound: Realised Price-to-Liveliness Ratio ($33.2k) – accounts for coin activity on-chain
The current market recovery resembles previous recoveries in the transitional phase. Long-term holders demonstrate low spending, while the Realised Price-to-Liveliness Ratio rises, indicating a higher 'HODLer implied value' as a potential equilibrium point.

Bitcoin Price Performance and Wealth Rotation Patterns
In the first quarter of 2023, BTC prices surged over 68%, putting investors back in profit. Realised Cap HODL waves track USD wealth distribution in coin age bands:
- Supply aged 3 months or less: Hot Money
- Supply aged 3 months or more: HODLer Money
Wealth rotation patterns vary between bear and bull markets. During bear markets, Hot Money transitions to HODLer Money (declining Supply < 3 months), while bull markets see HODLers liquidating at high prices (increasing Hot Money). The Hot Money share is currently near cycle lows, accounting for 10%-15% of the stored wealth. In the market recovery, 4.9% of the wealth was transferred from HODLer Money to Hot Money as profits were taken.

Binary Supply Concept and Capital Rotation
The variant of the RHODL ratio compares single-cycle Long-Term Holders (6m-2y) to the youngest Short-Term Holders (1d-3m) to gauge rotation between extreme HODLing and distribution points. The current RHODL ratio structure reveals abrupt capital rotation, triggered by the FTX collapse. Coins transferred from long-term holders to new buyers, with a sharp decline in the RHODL ratio indicating an inflection point and a change in market dynamics.

Bitcoin Valuation Model: MVRV Ratio
The Market Value to Realised Value (MVRV) Ratio is a popular Bitcoin valuation model, representing an aggregate unrealised profit multiple in coin supply. 'Fair value' is evaluated using historical values for guidance. MVRV Ratio deviations from the all-time-mean value (1.8) indicate market phases:
- Depression: MVRV < Low Band (green)
- Recovery: Low Band (green) < MVRV < Mid-Range (blue)
- Excitement: Mid-Range (blue) < MVRV < High Band (red)
- Euphoria: High Band (red) < MVRV
Currently, the MVRV stands at 1.4, suggesting a recovery phase. The all-time-average MVRV (1.8) implies a price of $36.1k, a point of psychological importance that prompted profit-taking in 2016, 2019-20, and mid-2022.

Accumulation Trend Score and Investor Behaviour
The Accumulation Trend Score measures the aggregated balance change in on-chain wallets over 30 days, with the higher weight assigned to larger entities (whales, institutional-sized wallets). In the early stages of market recoveries, distribution typically occurs, with trend scores falling below 0.25.
The recent rally towards the 2021-22 cycle baseline (~$30k) mirrors investor behaviour observed in 2019. For the past two weeks, the trend score has remained above 0.75, indicating a positive pattern in the market.

Conclusion: Regulatory Pressure and Market Resilience
In conclusion, the digital asset market has faced significant regulatory pressure this week. Despite this, Bitcoin holders' conviction and confidence appear unshaken. While Binance has been targeted by the CFTC, there is no substantial evidence of investors flinching.
The aggregate stablecoin supply has experienced a 22% reduction since its peak a year ago. This represents a net capital outflow from the industry but may also be a force buoying the major cryptocurrencies, BTC and ETH, as investors return to holding the most trustless collateral. As various metrics and trends suggest, the market is currently in a recovery phase, with the potential for future growth as long as regulatory pressures do not overwhelm investor sentiment.