U.S. Jobs Report: The gig is up!
News
|
Posted 09/01/2024
|
2447
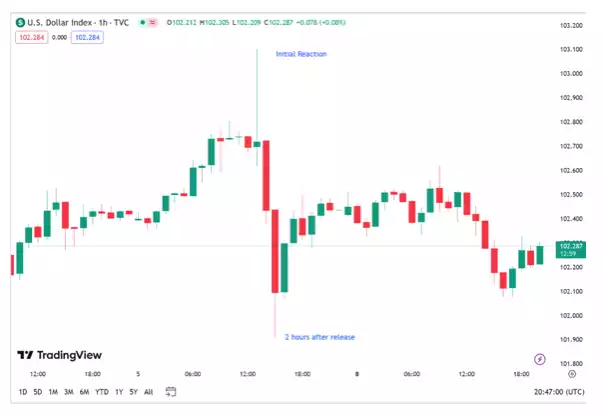
Last Thursday’s U.S. jobs report caused quite a stir – with the DXY at first rising to 103.1 on a figure of 216,000 against the 170,000 estimated. It was the reaction that followed, however, that is garnering the most attention. After 11 months of revisions in 2023, 10 of the 11 have been revised down. Statistically there is a 1 in 1000 chance of this occurring, so when the DXY collapsed 2 hours later to 101.9, it appeared that traders were finally starting to question the legitimacy of US numbers.
Revision, Revision, Revision
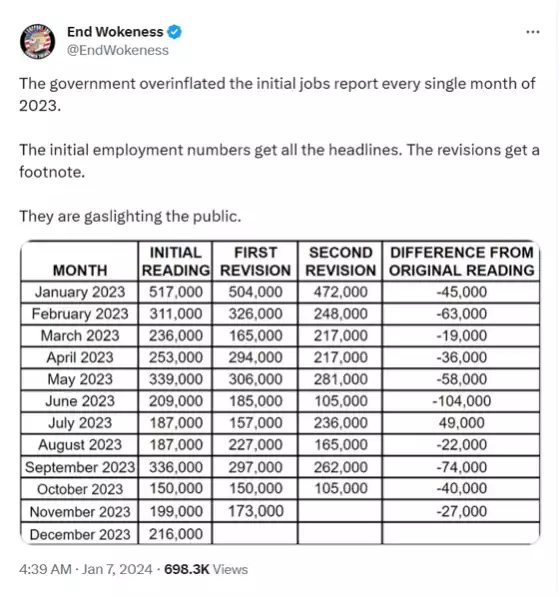
In a recent post from EndWokeness they have broken down the current job market numbers, showing the specifics of the revisions. Thinking in probabilistic terms this is like getting 10 out of 11 heads in a game of heads and tails. As this data is assumed to be non-biased, you should be as likely to get a revision up as a revision down. Now the probability of this happening is 0.1%, a statistical unlikelihood which can only lead any logical person to one of two conclusions. Either Biden is one very lucky President with his Bidenonomics policies able to move unemployment numbers at will, or someone is cooking the books.
Breaking down the data
So why was the reaction so negative 2 hours after the report? The numbers showed firstly the following:
- November revision of -27,000 jobs and October revision -45,000
- 1.5 million loss in full time roles (you read that right!)
- 676,000 people leaving the labour force (labour rate has never recovered since Covid)
- 52,000 out of 216,000 government jobs created (24%)
- 8.6million (a record) number of people with 2 jobs which skews the unemployment rate with double counting
So nutting this out in plain speak… with 216,000 jobs created and 72,000 revised down, actual job gains were 144,000 - well below the 170,000 estimate. 1.5 million people lost their full-time job. These jobs were replaced with 1.644 million part time jobs, with 8.6 million people in the US currently willing to fill these jobs as a second job, skewing the unemployment rate of 3.7% but not being measured or reported. In fact reviewing a recent Biden tweet – “A record breaking Biden Economy in 2023” 2.7 million jobs were created... It appears in December 1.7 million of those were part time, meaning no more than 1 million full time jobs could have been created in 2023 (but I’m sure there’s a revision in that…)

Due to the state of the employment market 676,000 people left the employment pool due to death, retirement or disillusionment, dropping the participation rate to 62.5%. It was 62.8% the month before and 63.3% pre-Covid. More importantly, it has been on a steady decline since the year 2000 when it peaked at 67.3%.

So the reversal in the DXY following the report shows traders are starting to look deeper into the numbers and coming to the realization that they are not reflecting the fortunes that are being spruiked by Biden.
Wages have failed to keep pace with productivity… what if?
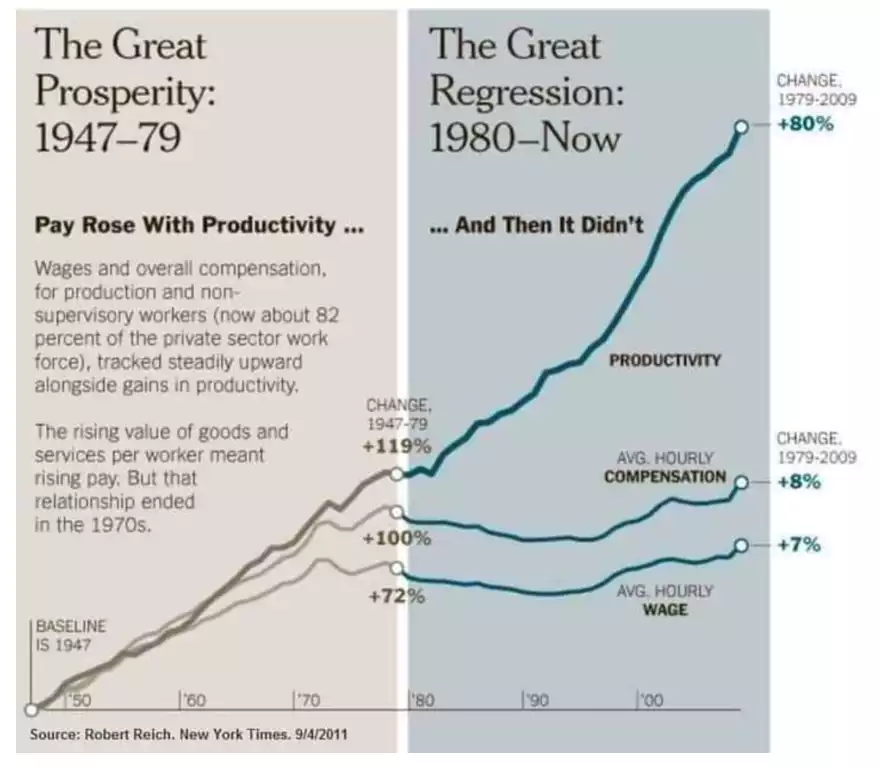
Since around 1970, wages have failed to keep up with productivity, with monopolies and loss of unions some of the reasons being blamed. What if the real reason wages have not kept up with productivity is because unemployment is systemically higher than what has been reported over the last 50 years? The 1960/70’s was the beginning of women’s liberation which added huge amounts of labour to the workforce as woman sorted out their financial independence. In 2022 wages generally kept above inflation as an anomaly due to worldwide migration pausing in the prior years due to Covid, keeping up with productivity changes.
Another manipulation in employment can be currently seen where a similar large input into the employment pool has been occurring, with over 12 million “refugees” entering the US under the Biden regime.

Now these refugees may not be part of the employment pool, but it looks like in the future there is all intention that they will be added, and 2.7 million jobs in 2023 is a drop in the ocean compared to 10 million people looking for work. Additionally, these immigrants may have taken “cash” paying jobs away from other Americans lowering their overall pay (though obviously underreported). So what will this do to wages and productivity tracking?
E.J. Antoni Ph.D had some great analysis in a recent well thought through tweet following the release of the NFP report. He broke down some of the key statistics, and he estimates the current unemployment rate at 6.4%-7.5%.
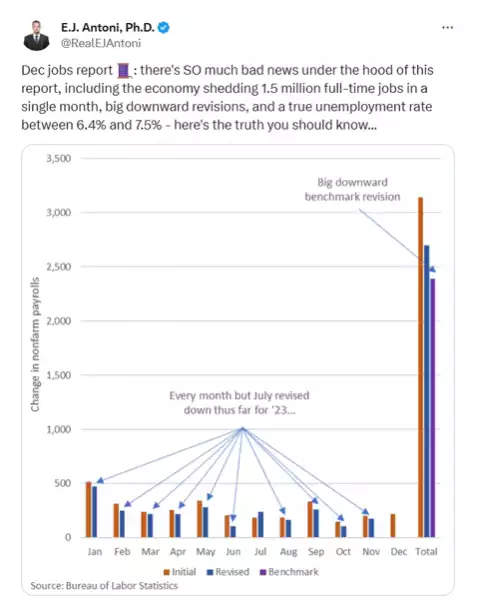
He has also been tracking the NFP data vs employment level from the household survey, which have been diverging since March 22, which in December saw a drop of 683,000 compared to the 216,000 NFP gain.
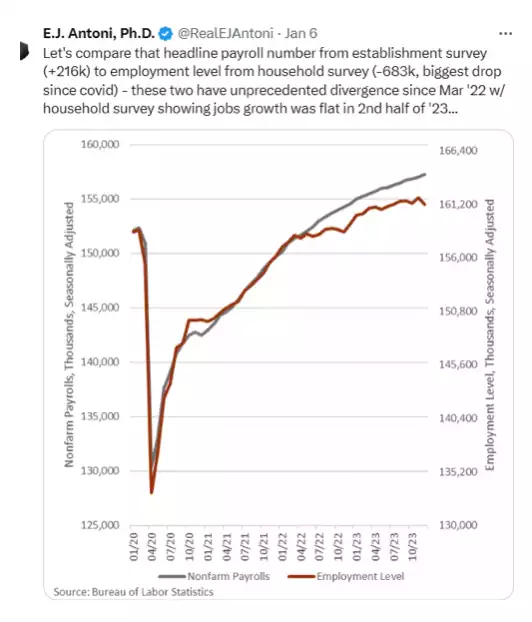
As you can see the numbers being reported are starting to look suspect and statistically improbable and people are starting to dissect them with more vigour. The results since the 1970s are showing a very different unemployment scenario, that without labour tightness, wages will continue to underperform productivity and inflation. So with migration again soaring worldwide, prepare for more wage underperformance and more *unemployment data manipulation*.