Trump Wants A Weaker Dollar Amid Dollar Strengthening Policy – Can He Have Both?
News
|
Posted 04/02/2025
|
2030
Trump has been very vocal about his desire to weaken the U.S. dollar and lower interest rates to encourage economic activity. However, while he imposes policies that should strengthen the U.S. dollar, many wonder if he can have his cake and eat it too. According to 54 years of DXY data and 350 years of land data – he most likely can.
The 16-year DXY Cycle and the 18.6-year land cycle suggest the U.S. Dollar has peaked.
The U.S. dollar index (DXY) is a measure of the value of the U.S. dollar relative to the value of a basket of currencies, of its most significant trading partners - the Euro (EUR), Japanese yen (JPY), Canadian dollar (CAD), British pound (GBP), Swedish krona (SEK), and Swiss franc (CHF).
The DXY started in March 1973, soon after the dismantling of the Bretton Woods system - with a value of 100. It has since traded as high as 164 (in February 1985) and as low as 70 (on March 16, 2008).
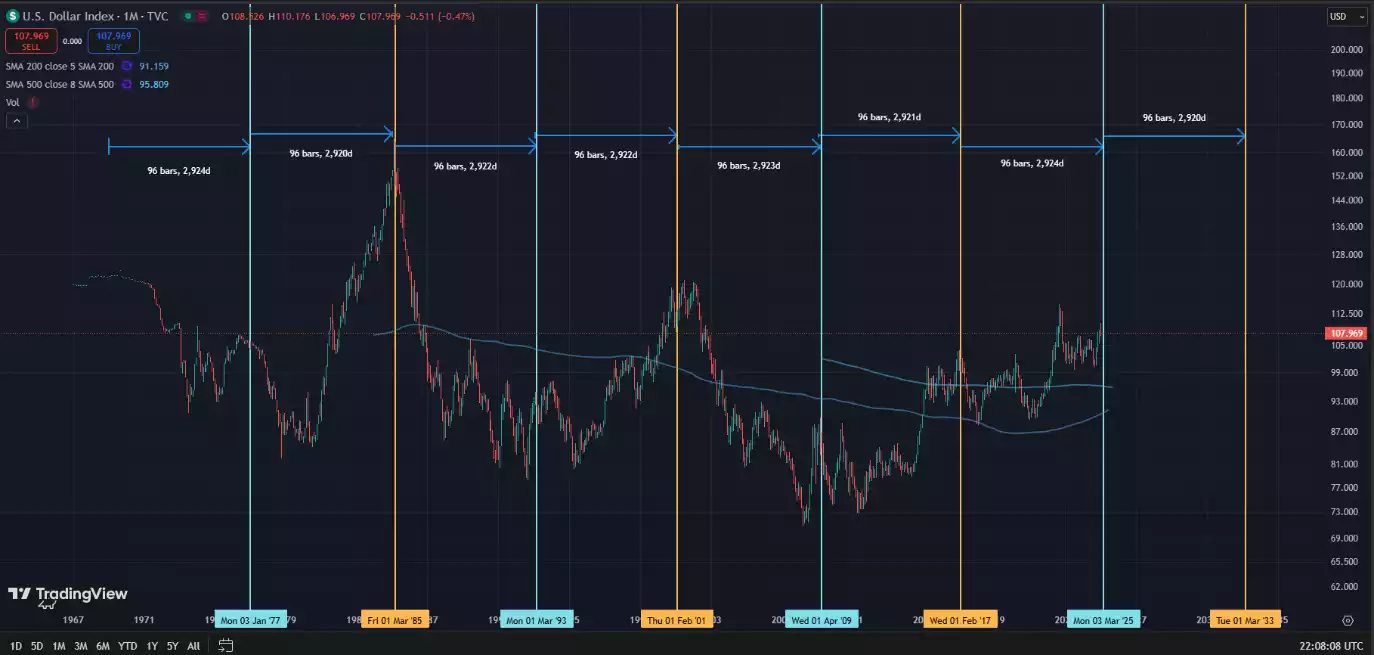
Before 1971 the dollar had been relatively fixed by international agreements, and any cyclical behaviour would have been crushed by that governmental action. However, what has been observed since President Nixon abandoned the Bretton Woods accords 54 years ago - and the dollar was allowed to float - is a pattern of approximately 16-year cycles, from peak to peak (made up of two 8-year-long sub-cycles).

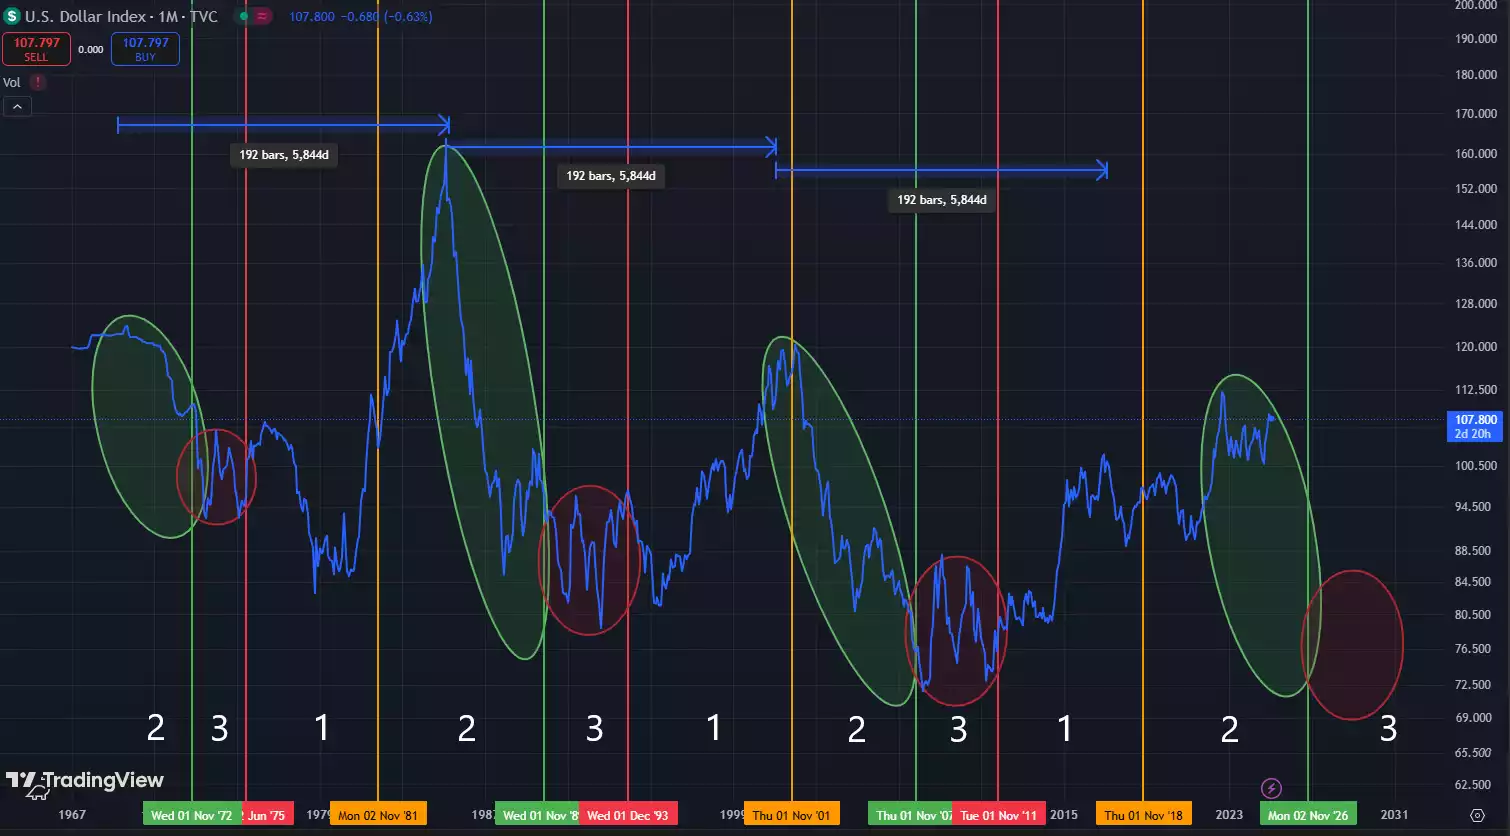
So far - we have seen three 16-year DXY cycles play out and are currently 50% of the way through the fourth. The big dollar tops were in 1985, 2001, and 2017. This leads us to a sub-cycle top expected in 2025, with a multi-year decline in dollar strength expected to follow – after which the dollar would strengthen - into a major DXY top in 2033.
This lines up quite perfectly with the 18.6-year land cycle (which has about 250 years of recorded data in the U.S. and about 350 years in the UK).

The shortest cycle on record is 17 years, with the longest being 21 years. With the previous top in 2007 (The GFC) - land and stock prices are expected to peak between 2025 and 2028. The final 2 years of this cycle, with exponential growth in land prices, would coincide with the dollar declining in value.
Therefore, the expectation of the DXY cycle to continue as usual, into a decline from 2025 onwards, coincides with the land cycle putting in its final blow-off top. While most will credit this period of prosperity to the Trump presidency, 350 years of land data and 54 years of DXY data suggest this would have occurred regardless of who was the U.S. president.
Furthermore, the DXY increasing in value, into a major top in 2033 would coincide with the 4-year land recession expected after the winners curse phase of the land cycle – where to dollar would strengthen as a flight to safety asset.
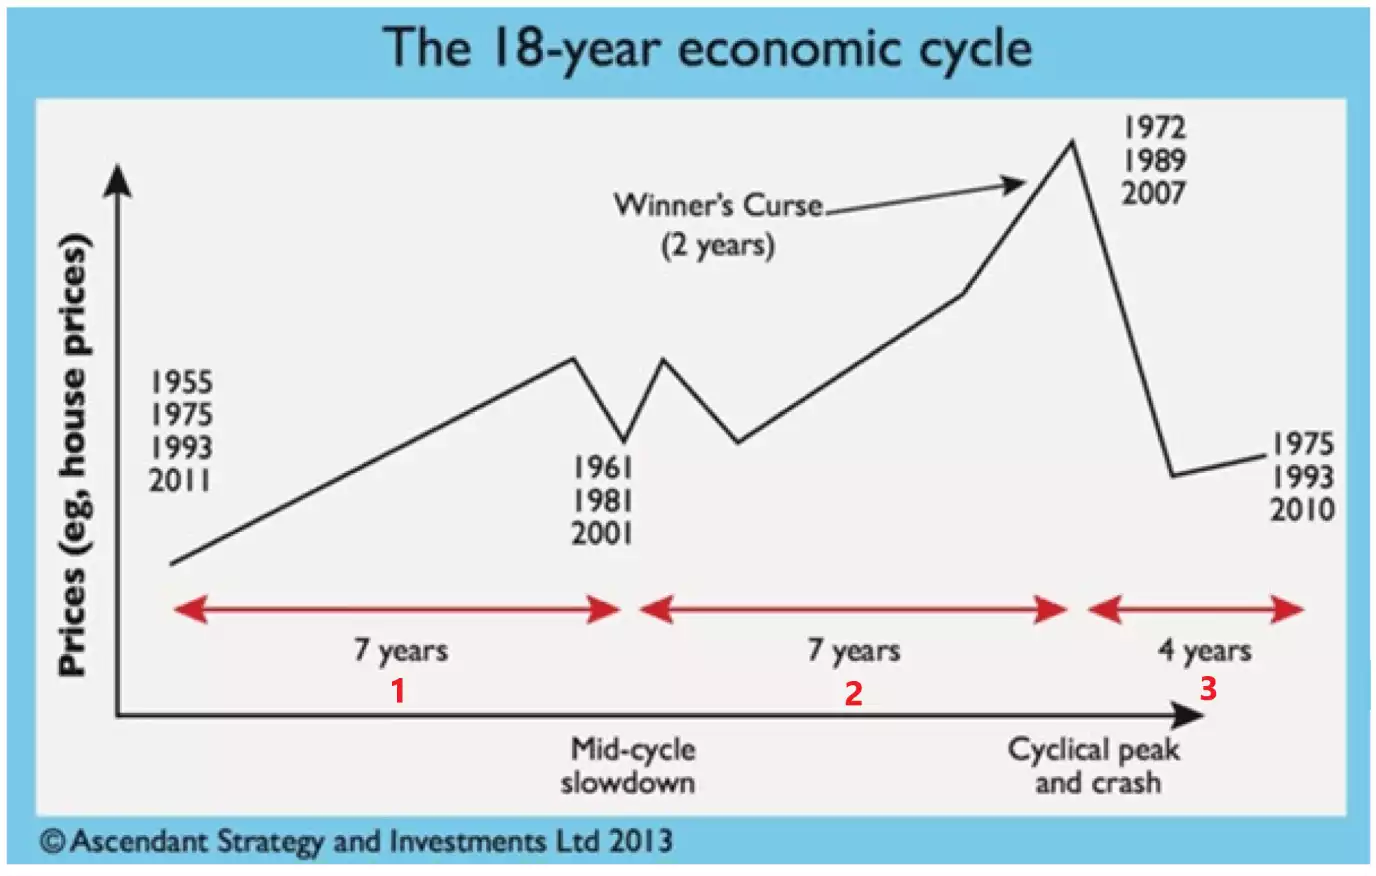
The 18.6-year land cycle, involves 14 years of land prices increasing (two 7-year uptrends, divided by a mid-cycle slowdown) which coincides with economic expansion - and 4 years of falling land prices, coinciding with recession. We can call the two 7-year expansion phases – Phase 1 and Phase 2, and the 4-year recession Phase 3.
The final stage of Phase 2 (called the winner’s curse) involves exponential overvaluations driven by leverage and liquidity, where the DXY falls off a cliff – just before systemic financial collapse. This is what we are on the lookout for today.
Looking at the 3 phases of the 18.6-year cycle

In Phase 1 the U.S. dollar gains strength against other currencies with the U.S. economy leading economic expansion. The DXY moves up, in conjunction with U.S. stocks and land prices. Gold moves into an accumulation phase after a sustained run-up during Phase 2 and Phase 3 of the previous cycle.
In Phase 2 we find increased liquidity in the system - we see stocks and land become increasingly over-leveraged - and we see hard assets like Gold and Silver perform incredibly well, in a sustained uptrend.
With increasing money supply the dollar loses value -and the DXY settles into a downtrend.
As we move into the final years of Phase 2 (called the winner’s curse phase) - we see the DXY fall off a cliff - while stocks and land get over-leveraged and overpriced - unsustainably so – while hard assets like gold and silver continue on sustainable and steady price increases – This is where we are today.
Toward the end of this ongoing phase - investor sentiment becomes overconfident and complacent as all assets move up together - everyone is a “winner”, and risk management goes out the window - just in time for a systemic breakdown.
This leads to the final phase of the cycle - the collapse (Phase 3).
In Phase 3 we see systemic failures and resets. Land and stock prices crash - going from being overpriced to underpriced. The U.S. dollar starts to recover, after getting hammered in the previous phase. Hard assets like Gold and Silver continue to gain value as investors and central banks flood into precious metals to seek shelter from the storm.
While stocks and land prices rise in Phase 2 and crash in Phase 3 - precious metals steadily increase in both Phase 2 and Phase 3 – gaining value through both the euphoria and the crash. This places it in a unique position for the upcoming 8 years as the premier asset of choice for both liquidity-driven capital growth and safe haven capital preservation.
So, while Trump has come in with the promise to lower rates and weaken the U.S. dollar, while simultaneously enacting tariffs that should strengthen the dollar - the question remains – can he have his cake and eat it too? According to typical cycle behaviour – he most likely can!
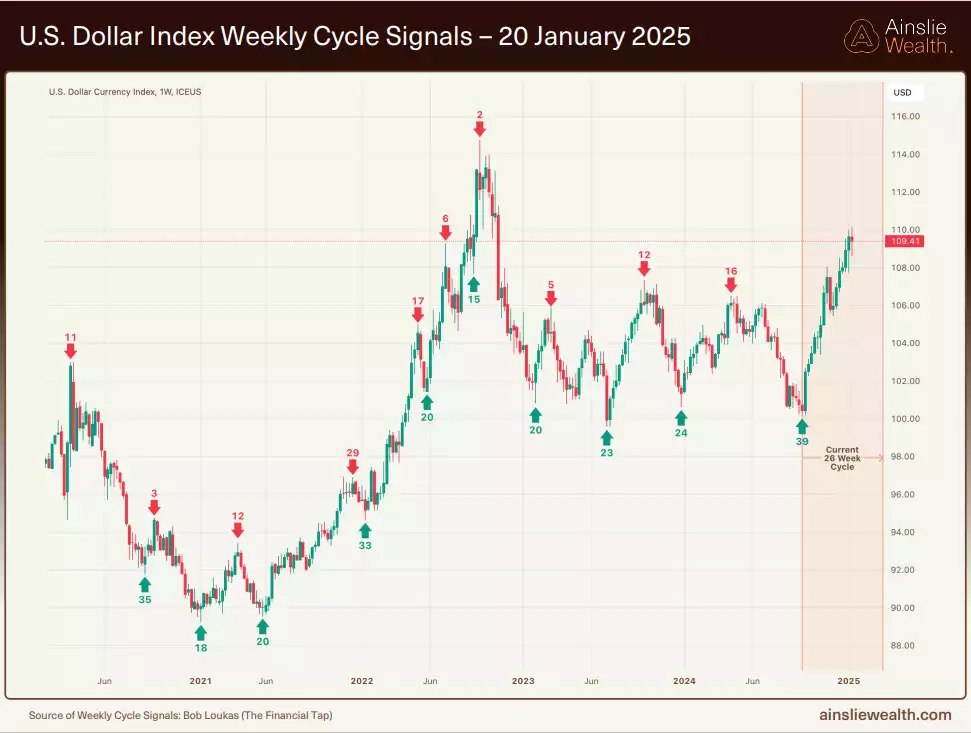
While we are hunting for a macro DXY top on the 8-year cycle – zooming in – we can see a likely weekly top forming at the moment – which would be an early sign of a larger decline setting in.

While many wonder if they have missed the boat on gold, due to its recent price appreciation – what we might be seeing in a macro sense - is some of the best longer-term buying opportunities on hard assets like gold – as the macro DXY downtrend takes effect.
If this cycle on the DXY were to play out, it would lead into the winner's curse phase of the 18.6-year cycle perfectly - where all assets rise together - amid an increase of liquidity, leverage and complacency - followed by a broad-based systemic financial collapse, and a decline in land values.
While a falling dollar and increased liquidity would result in significant price increases for hard assets such as gold and silver – they will both continue to see macro price increases, as flight to safety assets after the collapse phase – being both decentralised and limited in supply - while most other assets struggle to recover.
During the recovery phase, as retail investors notice that the precious metals sector is one of the only ones performing well, speculation enters the market. Silver, with its smaller market cap, is greatly affected by this, playing catch-up to gold and significantly outperforming it as the gold-to-silver ratio falls off. So, while gold tends to outperform silver initially, leading into the collapse phase (phase 2) – it is during the recovery phase (phase 3) that Silver takes centre stage.
Watch the Ainslie Insights video discussion of this article here: https://www.youtube.com/watch?v=Dhodr0ltYSc