Troubling Signs for the Global Economy
News
|
Posted 02/10/2018
|
8878
US shares and the USD rallied strongly overnight on the news of the re-badged NAFTA deal with Canada and Mexico. One could think all is good in the world. However North America is not ‘the world’ and the rest is not going so well. One highly correlated indicator of the broader global economy is South Korean exports. Bank of America Merrill Lynch released this update back in April showing some pain looks likely ahead:
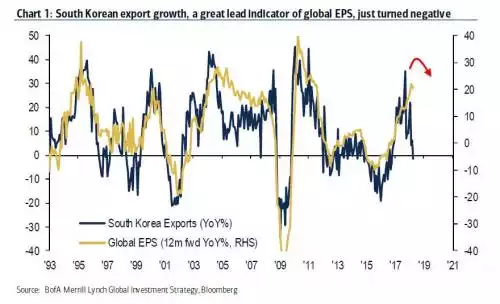
However on Friday night we saw that mild dip into the negative depicted above plunge to -8.2% off the back of Trump ‘making America great’ at the expense of the rest of the world with exports to the US plummeting 11.8% which dragged China’s exports down 6.5%.
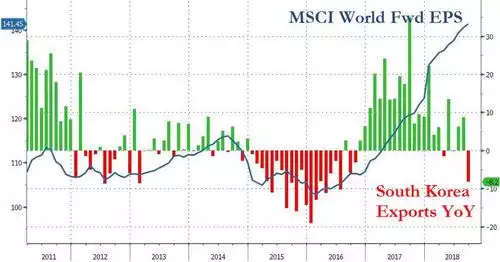
Last time we saw a plunge into the red was the 2015 China devaluation crash that saw global shares down nearly 20% and a worldwide rush into gold and silver.
This red flag is happening in unison with a troubling plunge in credit impulse (the change in new credit issued as a percentage of the gross domestic product (GDP)) according to the Institute of International Finance (IIF). That change in the flow of credit (the blue bars below) is the greatest since the onset of the GFC at -2.7% compared to -2.9%.
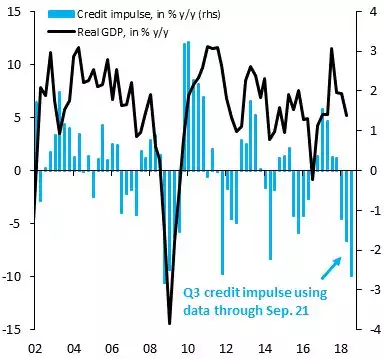
And whilst the US is looking ‘awesome’ right now it is worth revisiting how exactly that happened whilst on the topic of debt driven GDP…
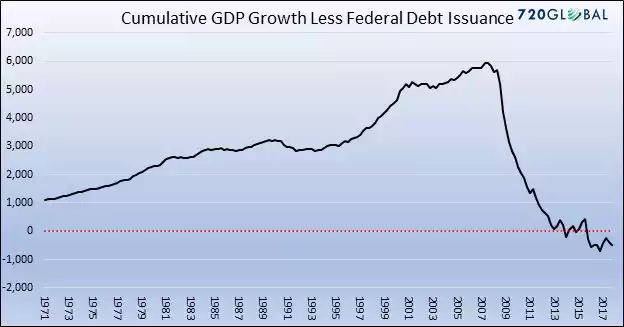
And so, as we reported last week, we have the US Fed on a Titanic-like course to raise rates into an economy driven principally by new debt, and so raising the cost of servicing all that debt, and the rest of the world decidedly weak already.
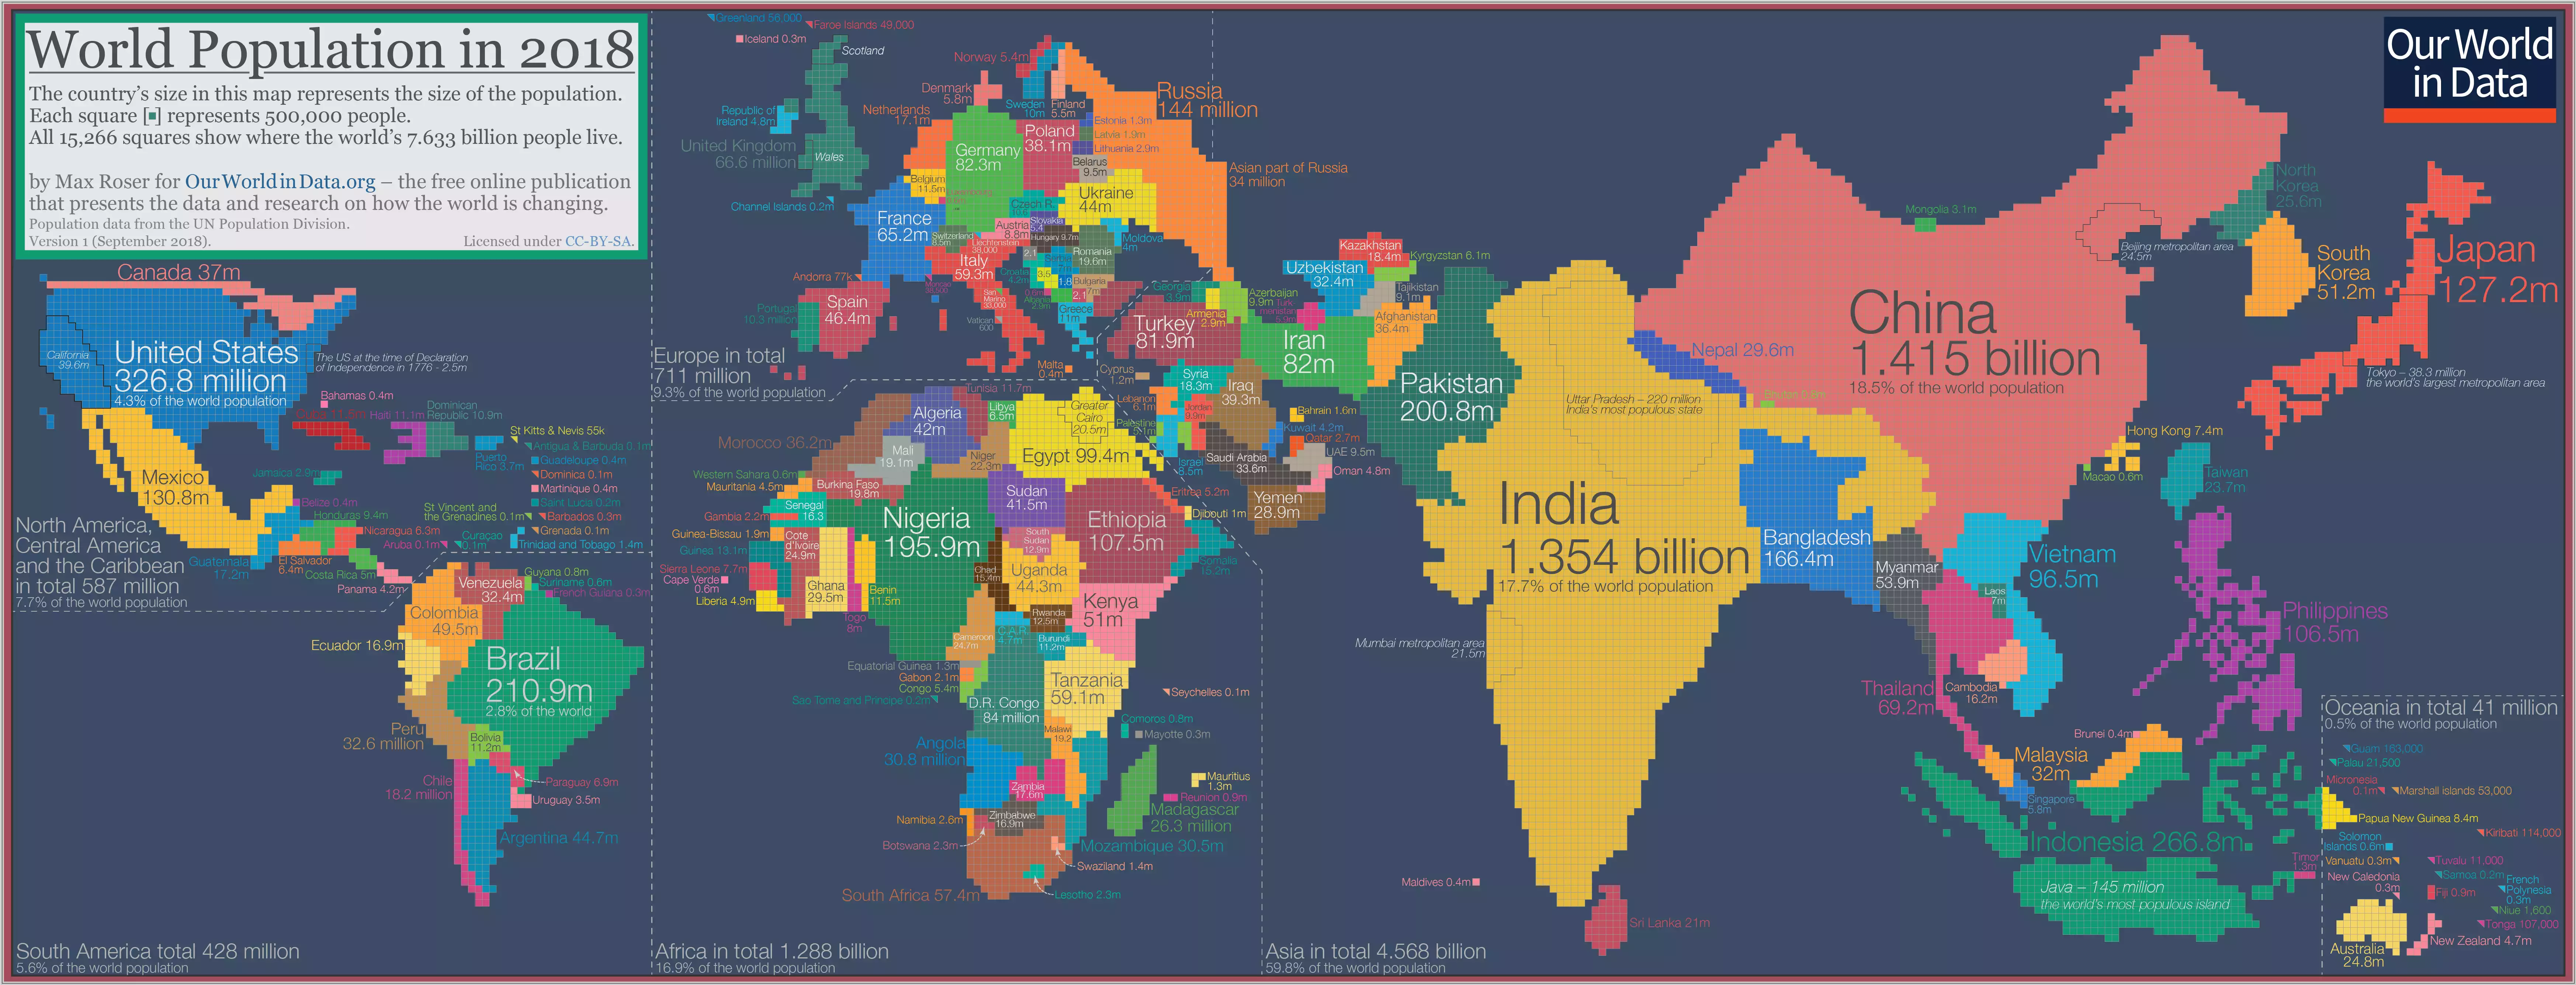
On the topic of a global perspective, check out the fascinating map below of the world map scaled by population (click to go to the full res original). When looking at the map, remember the 2 countries with the highest affinity for gold are China and India. It puts the US, Mexico and Canada into perspective too…
