Timing The Upcoming Market Crash
News
|
Posted 06/03/2025
|
4977
While it is clear that there is a broad-based financial crash imminent in Western economies, timing this can be tricky. However, by using a combination of cycle timing, technical indicators, sentiment readings, tracking leading markets, and observing economic indicators - we are able to quite accurately discern the proximity of such an event.
Cycle timing window.
We continue to track the 18.6-year economic cycle, with the conviction that we are in the final phase of its uptrend. With 350 years of data the shortest cycle on record is 17 years and the longest is 21 years. The previous peak was in 2008, before the Global Financial Crisis; therefore, we would expect the peak of this cycle anywhere between 2025 and 2028.
In this final uptrend phase, all markets rise together along with complacency, greed, and leverage - followed by a broad-based financial crash after which we see the recovery phase leading into the next cycle.
While gold and silver increase in value, along with most markets, in the final phase of the uptrend (with an increase in global liquidity), they are one of the very few assets to continue increasing in value after the crash during the recovery phase while most other markets struggle. Silver in particular takes centre stage in the recovery phase, and we see the Gold to Silver Ratio reduce.
From a macro timing perspective, we are currently in the window for the cycle peak, and it would be reasonable to expect a recession in Western economies commencing with a financial market crash sometime in the next 3 years.
Technical Indicators
US10Y-US02Y Treasury Yield Spread
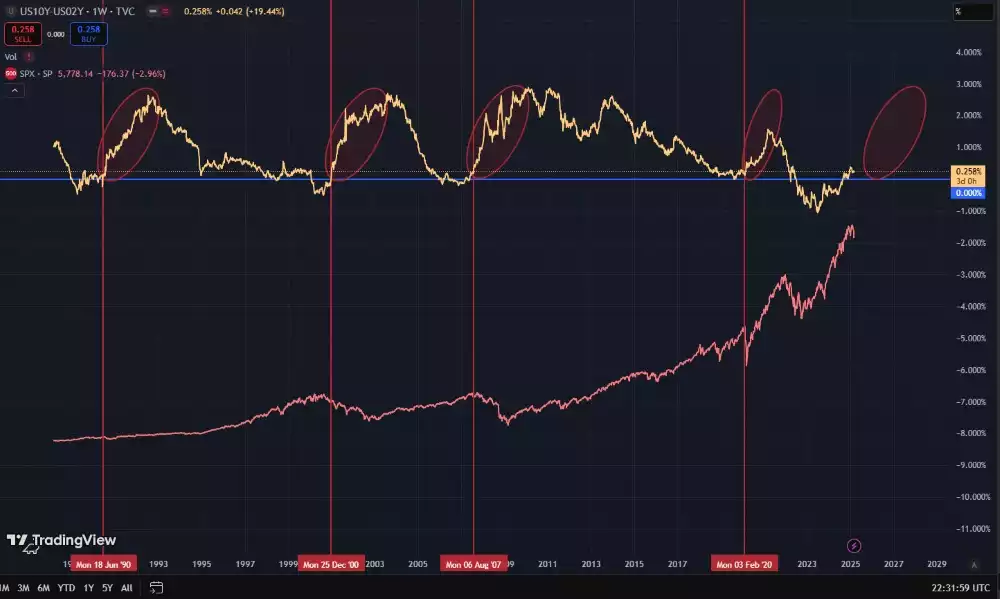
An important technical indicator to track is the US10-2 Treasury Yield Spread which is the difference between the 10-year treasury rate and the 2-year treasury rate.
We notice all major 18.6-year cycle crashes (and mid-cycle dips) were preceded by this yield curve inversion and un-inversion and kicked off when we saw its acceleration to the upside.
Today we have seen the inversion and un-inversion on the lookout for acceleration. While we could chop around inverting and un-inverting a few times before seeing acceleration as we did in the GFC, the current setup is precarious and one worth keeping a close eye on to note acceleration to the upside, which will coincide with a financial crash.
Stochastic RSI reset on the S&P500 12M chart

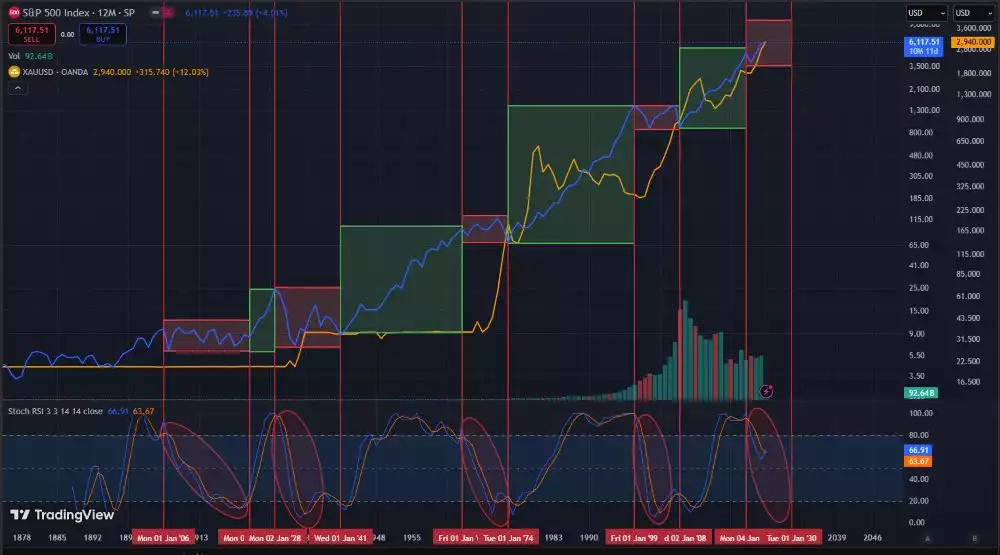
Stochastic RSI (StochRSI) is a combination of the Relative Strength Index (RSI) and the Stochastic Oscillator. It is a technical indicator that measures the relative strength, of the Relative Strength Index. It's used to identify overbought and oversold conditions in the market, and can help identify trend reversals, momentum shifts, and divergences between price and momentum.
We notice that during major crash phases, this indicator resets from overbought to oversold on the macro timeframe, while the S&P500 ranges sideways for about a decade - while gold outperforms.
Today we see a divergence - with the S&P making new highs, while the Stoch RSI rests, indicating that we are not far from this stock market crash and sideways ranging phase for major stock markets.
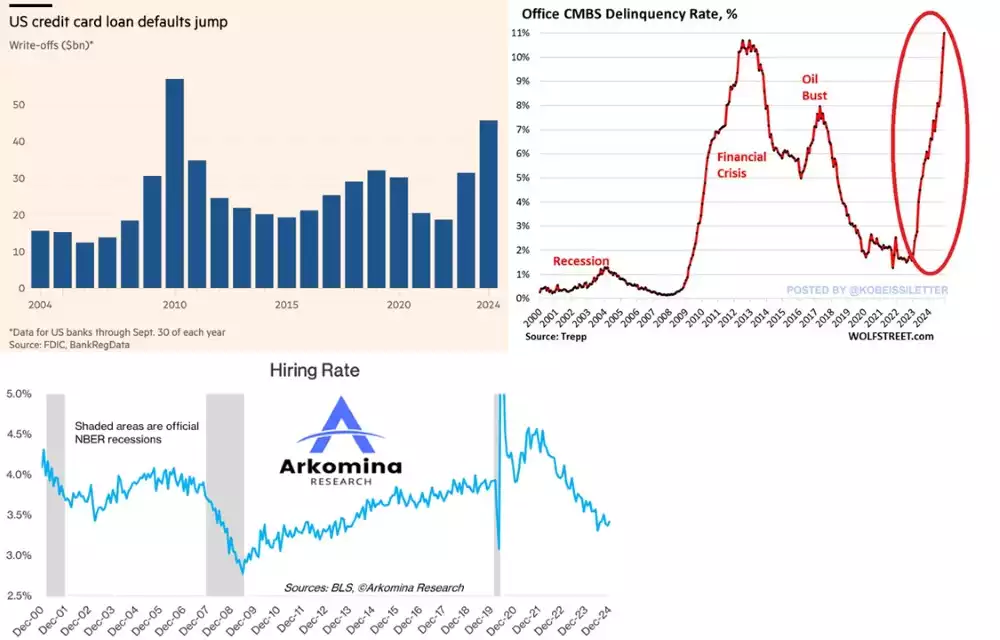
Early Economic Warning Signs
As we approach this macro peak, markets will continue up, in the face of widening cracks in the economy, this can be seen today in the Commercial Mortgage Backed Securities defaults, credit card defaults and declining hiring rate to name just a few.
Land markets - A Leading Indicator
While the previous 18.6-year cycle peak was marked by the U.S. housing market crisis it is reasonable to expect that this cycle will usually be led by a decline in the land markets. With stocks being further along the risk curve in an environment of complacency, they tend to rally longer in the face of large systemic cracks.
Leading into the 2007 crash, we noted the land markets putting in a macro downtrend while the S&P continued making new highs.
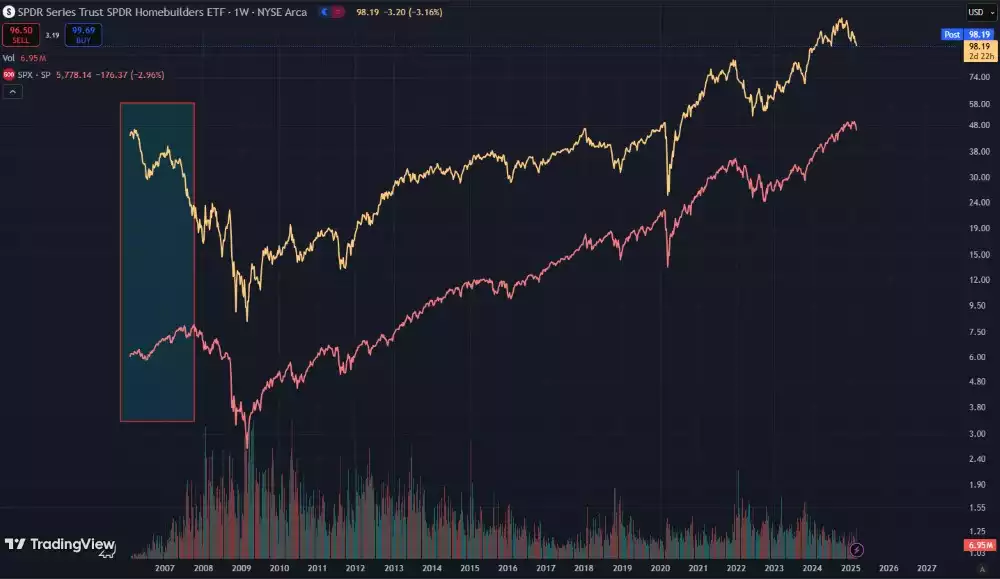

This is yet another leading indicator to keep an eye on as we get closer to the upcoming macro financial crash every week.
Market Sentiment
Today we notice that there is a healthy amount of fear in the markets while most major indices are near, or at, all-time highs. This divergence between technical strength and fearful sentiment shows us that we are not at a macro peak. At macro peaks, we can record a sentiment of complacency amid market participants along with an overwhelmingly positive news coverage of financial markets.
With major concerns around everything from Chinese AI to Trump tariffs, the prevalent fear in the markets is a far cry from the sentiment seen at major tops. However, this can change, and fast. Tracking major fear and greed indices along with social media chatter on X and mainstream news stories helps keep a finger on the pulse of market sentiment.
Summary
Combining all of these indicators helps us ascertain that we are currently in the timing window for a macro financial peak with a close eye to be kept on the land markets diverging from stock markets as a leading indicator – the market sentiment getting overly complacent as a warning that we are getting closer to the peak and finally, the 10-2Y yield accelerating, to mark the peak.
While some try to time these peaks perfectly, the astute precious metals investor understands that gold and silver typically rise into this peak, and continue rising in the recovery phase (when most other markets like land and stocks struggle to recover). Therefore, getting into precious metals provides investors with a vehicle to easily navigate both the complacency phase and recovery phase, taking advantage of both. It enables them to achieve significant capital growth and secure shelter from the storm simultaneously.
Finally, the more active precious metal investor will trade the Gold to Silver Ratio being aware that gold may outperform silver leading into the collapse phase (resulting in a high GSR), with silver taking centre stage in the recovery phase (resulting in the GSR reducing) – therefore taking advantage of a high reading by positioning in silver and a low reading, by converting their silver to gold.
Watch the Ainslie Insights video discussion of this article here: https://www.youtube.com/watch?v=HUBJjHPGZaA