The Great Capital Rotation: From Tech to Gold
News
|
Posted 22/10/2025
|
1624
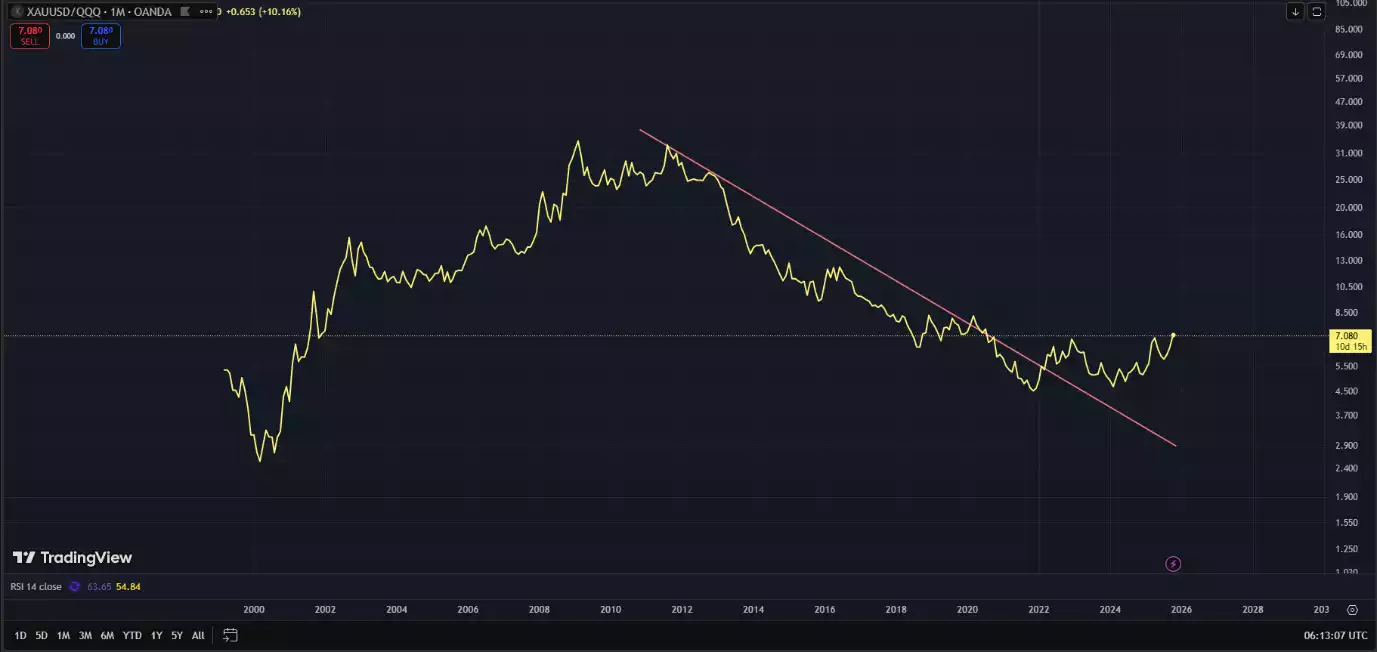
The chart below shows gold priced in terms of the NASDAQ tech index, revealing a clear technical breakout from a decade-long downward resistance line. This breakout has now seen a successful retest, and the trend appears to be resuming with a higher high currently forming.
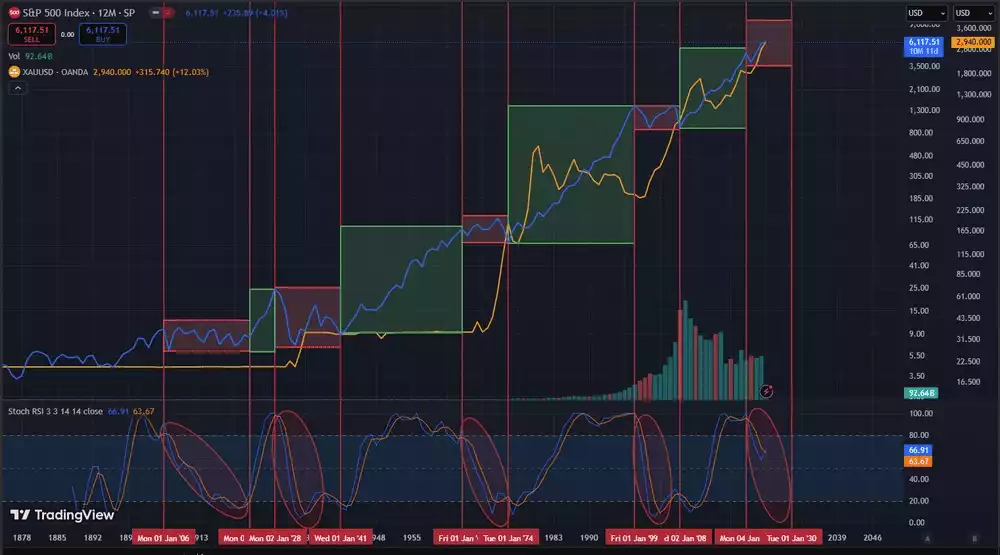
Supporting this is the second chart, which highlights a multi-year phase of gold outperforming the S&P500—a move now underway. Notably, the 12-month Stoch RSI is resetting, adding further technical strength to the case for gold’s next leg higher.
From a cycle perspective, gold entered a new 8-year cycle in 2022. The mid-cycle point, due in 2026, is typically where significant momentum builds—setting the stage for the next major move.
Meanwhile, amid one of the most volatile geopolitical environments in decades, central banks are accumulating gold at five times their usual pace.
.jpg?ver=eji8I6h5eCaOrgvuotgDJA%3d%3d)
While debate continues over whether gold’s recent move has peaked, more forward-looking investors are focusing on the broader trend, steadily averaging into the market with a long-term view.
Markets never move in a straight line, and periods of consolidation are inevitable. But when we look back a decade from now, what seems obvious in hindsight may well be that we were only just getting started.