The End of Negative Rates in Japan
News
|
Posted 20/03/2024
|
2768
In March 1995 Japan dropped their interest rates to 0%, from there they saw 2 periods of interest rate rises – 1999 in response to the dotcom bubble they lifted to 0.25% and in 2008 in response to the boom before bust of the GFC they lifted to 0.5%. Both times they were very quick to reverse back to 0. In January 2016 they dropped to -0.1% and that is where it has sat for 8 years. 8 years of paying the bank to hold your money, not the other way around. 29 years of close to 0 interest rates. And arguably 29 years of the Japanese Carry Trade inflating international markets.
So yesterday was significant as Japan firstly moving to back to 0% interest rates, from 8 years of negative interest, the dismantling of yield curve control, and finally the BoJ is also ditching purchases of risk assets like ETFs and REITs and reducing down their exposure to commercial paper and corporate bonds.
Deflation to Inflation
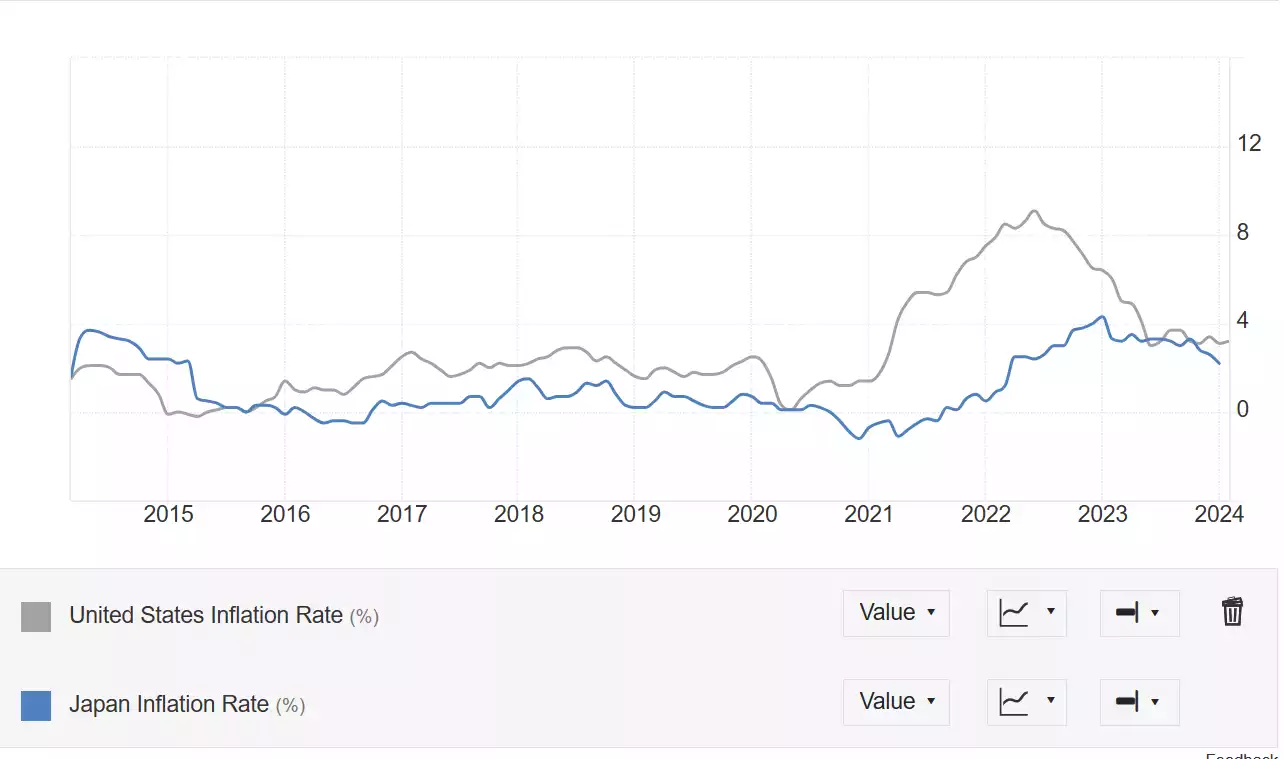
Over the past 10 years, Japan has seen long periods of deflation with CPI sub 0. At the end of 2021, this all started to change, with the worldwide covid stimulus pushing inflation rates up around the world, but even then as the U.S. hit 9%+ Japan only ever climbed to 4%. Now with aggressive interest rate rises around the world, Japan now sits at a relatively similar level to the U.S., albeit with much lower interest rates 0% vs 5.5%.

Despite the above graph showing 10 years of low inflation/deflation in Japan the issue in fact began in the 1990s, around when the aggressively low interest rate setting began.
Japan’s Lost Decade
Despite the above graph showing 10 years of low inflation/deflation in Japan the issue in fact began in the 1990s, around when the aggressively low interest rate setting began. From 1991-2001 Japan experienced a period of stagnation and price deflation, that historically has been know as ‘Japan’s Lost Decade’. With an overinflated property market, the BOJ raised interest rates aggressively seeing the brakes put on the previously bustling Japanese economy.
During the 1980s, so big were the real estate and asset bubbles in Japan, that the Tokyo Imperial Place sitting on 1.15sqkm in Tokyo was estimated to have a greater value than all the land in California. The Japanese stock market made up more than 50% of the total world market (NY at the time was 25%).
In 1989 the bubbles began to burst, seeing real estate values drop 60% by August 1992. The Japanese economy began to slow at this point dropping to 1% growth from 3% falling well behind the rest of the world.
In the late 1980s the BOJ put the brakes on its money supply which probably contributed to the equity and real estate bubble burst, but as these bubbles burst they continued to raise rates. It wasn’t until 1991 that the BOJ started dropping rates, the slowdown in the economy and the bubbles led to a liquidity trap, which appears only now 40 years on to be unwinding.
A Liquidity trap is when low interest rates become ineffective as investors start to believe assets will be cheaper tomorrow, so they wait and don’t consume, ‘saving their money’ creating a self-fulfilling deflationary scenario.
Spring Offensive
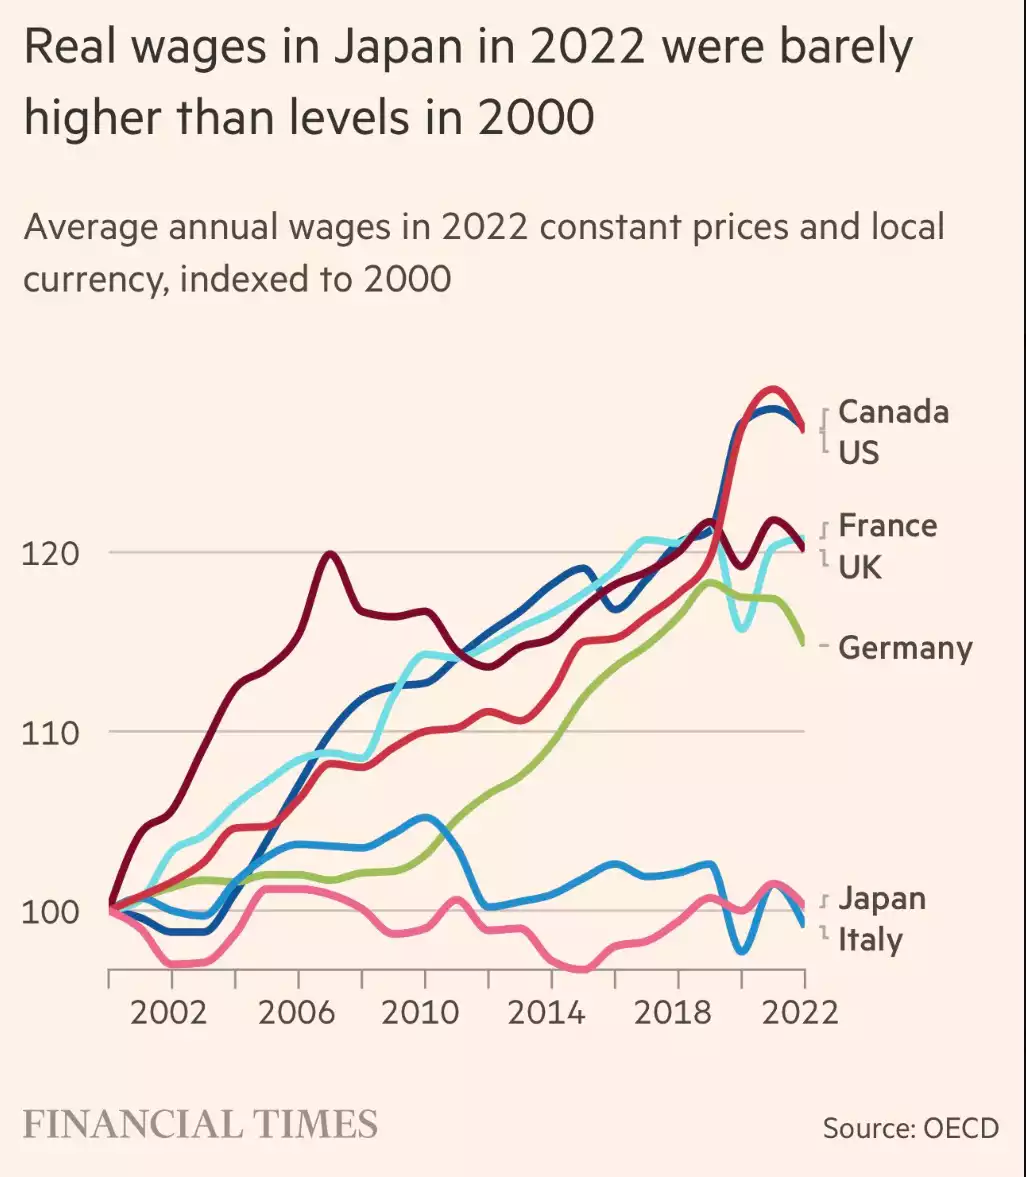
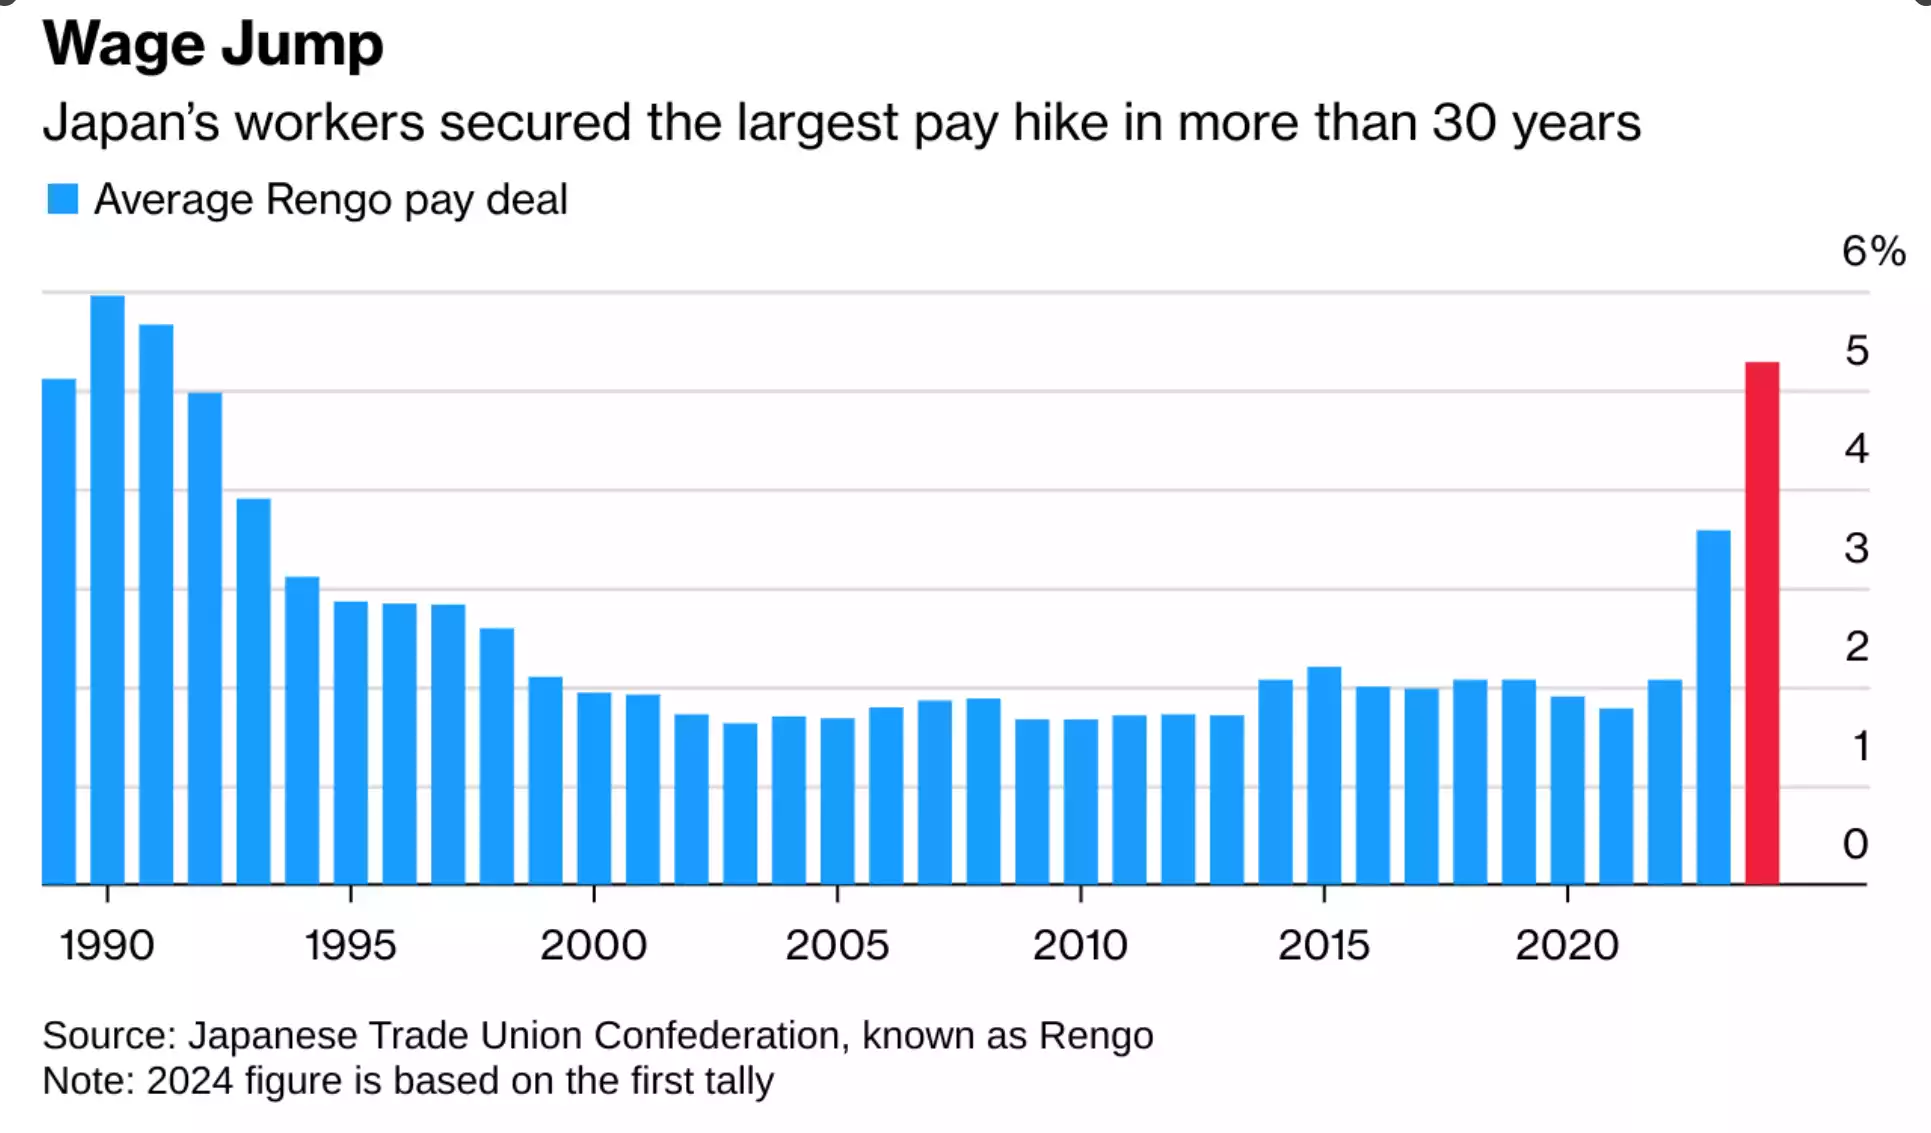
Interestingly the reason BOJs hand has been forced is not only because of the current inflation since 2022, they have held strong up until now, but because of what is known in Japan as Shunto – or the Spring Offensive, a period where labour unions negotiate for wage rises. Following from the 1990s – where Japanese wages ran at around 5% per annum - it increased, the deflationary period of 1990-2020s saw wages barely lift above 2% per annum.


In 2024 the Spring offensive has seen wages rise over 5% and in some cases, such as Toyota they have lifted wages by 12%. With wages feeding through to goods, the inflationary effect from wage increases on top of a weakened Yen due to a low interest rate setting have forced the hand of the BOJ needing them to start lifting interest rates as Japan joins the rest of the world and no longer in the decade long liquidity trap.
Carry Trade
We’ve bought your attention before to the Yen Carry Trade, Foreign Currency Markets – Are they the Pin for this Bubble? | Ainslie Bullion and finally this scenario may be rearing its head, with Japanese Investors more likely to start looking for investment opportunities within Japan, pulling their funds back from overseas asset bubbles that the leveraged trade has helped inflate.
How high Can they go
The question of course from here is how much more will the BOJ need to lift to battle inflation and how much more can it lift. With a GDP deficit of 200%, to put that in perspective the U.S. deficit currently sits at $3 5trillion, this is the equivalent of a $60 trillion U.S. deficit. Any lift from here will see huge amounts of interest payments that are likely unsustainable. And yet again, we find another example of where the debt trap will require more money, more introduced liquidity, JUST to service it. We may see temporary tightening, but math says it can’t last.