The Clock Is Ticking For Stocks: Bond Yields Set the Timer
News
|
Posted 18/11/2026
|
179
Key Takeaways
- Bond yields have historically peaked months before major stock market tops.
- In 2007, US stocks peaked 17 weeks after the 10 year yield did.
- Long dated US bonds sit in a cycle low window that could pull yields lower.
- Lower rates could favour gold and silver through 2027.
As we traverse the final phase of the 18.6 year land cycle (major lows recorded in western land markets every 18.6 years on average, more than 200 years of data), where most markets experience significant volatility amid land price declines (last one ended with the Global Financial Crisis), the US bond market provides a fine-tuned timeframe for hunting stock market tops.
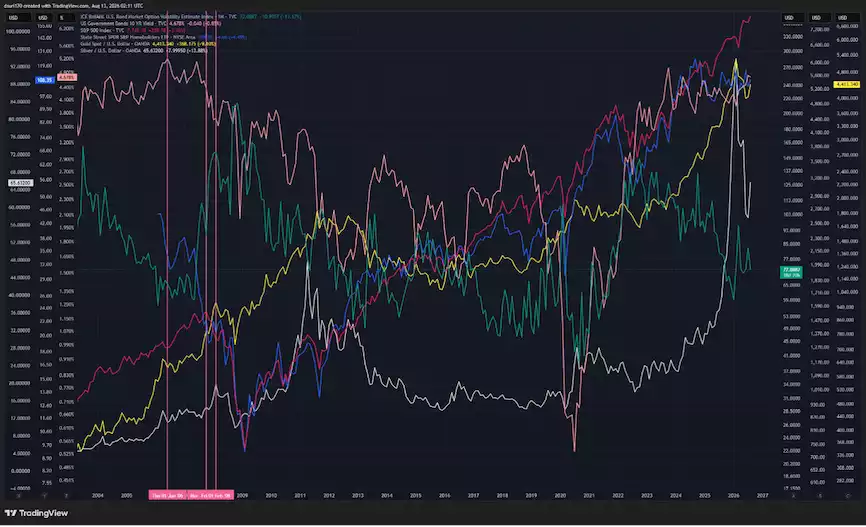
The chart below shows the global financial crisis precedent for this (in line with our current position in the 18.6 year land cycle), looking at the SP500, Homebuilders ETF, US10Y yield, MOVE index (bond volatility), gold and silver.
We see stocks (pink) and land (blue) crashing and struggling to recover, while gold reclaims all time highs and silver nears its 1980 record, both continuing on strong rallies, with gold leading silver.
If bond yields topped out in the week of 28 September, the implications for major stock markets are significant.
While falling yields can result in higher global liquidity and asset prices in the short term, along with a significant improvement in retail sentiment and forward looking expectations, they can create significant volatility on their way down, with the monetary easing generally being more reactive than preventative.
What does the GFC precedent show?
Zooming into the Global Financial Crisis precedent, we see 17 weeks between the US10Y yields topping (June 2007) and the SP500 topping (9 October 2007), before the downtrend in stocks began. This was after land had shown weakness for months, bond volatility had started trending up and gold and silver had experienced consolidations after significant rallies.
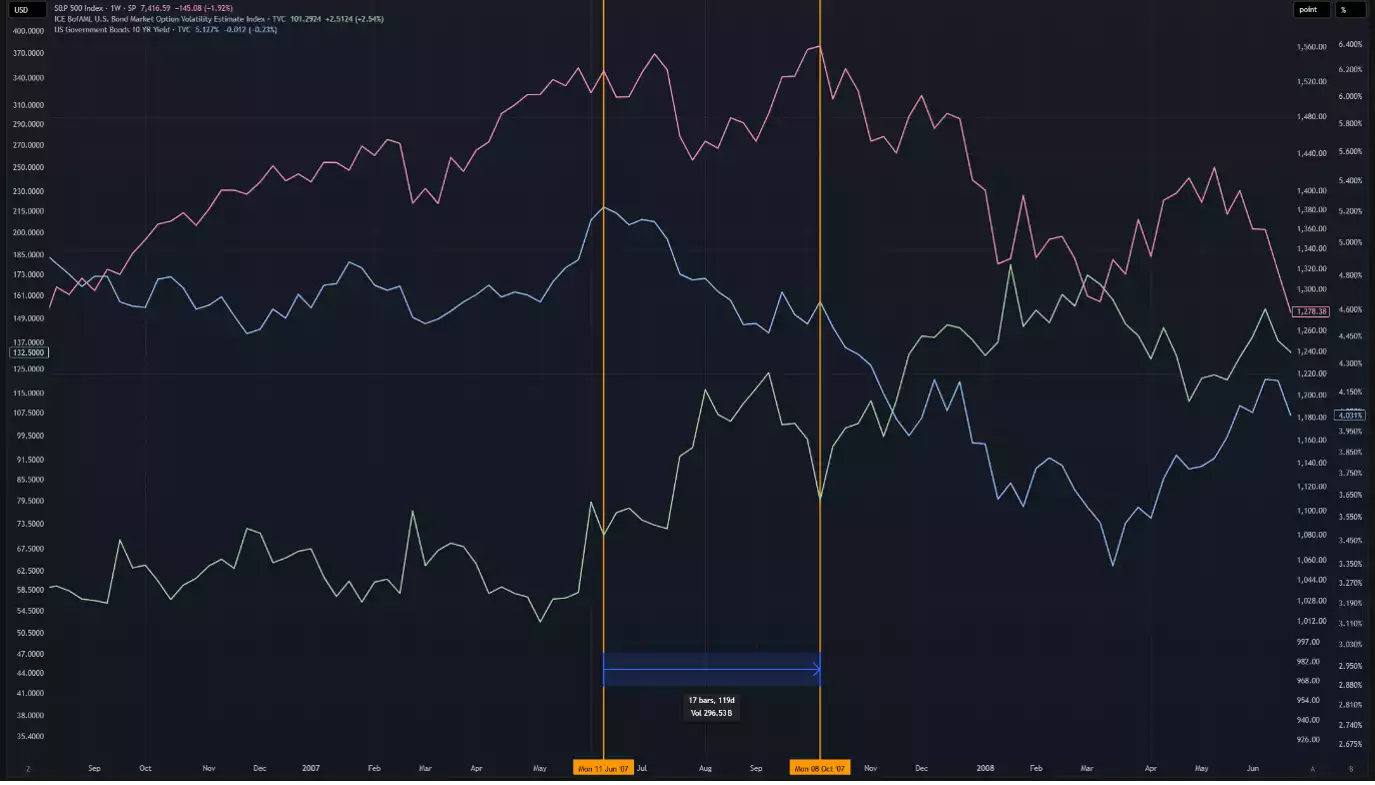
If the US 10 Y yield has topped in October (it touched 5.33% on 1 October, per Bloomberg via Yahoo Finance, 1 October 2026), the GFC precedent gives us till Feb 2027 for stocks to top out as a very rough guide. Similar to the GFC precedent, today we see the initial pullback in yields, stocks and bond volatility. In 2007, what came next was a short period of complacency and rising stocks, before the sub prime collapse.
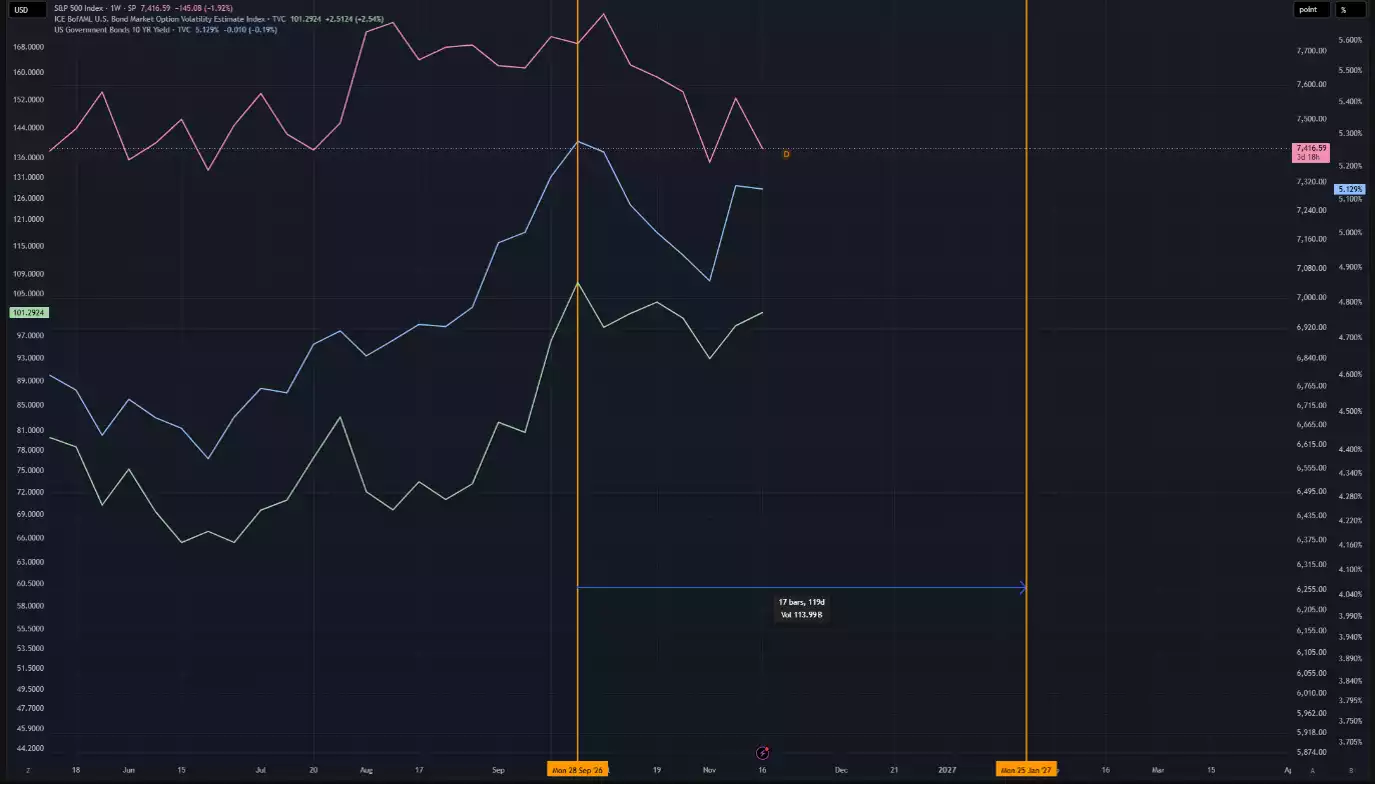
While this time's "event" will be different, the landscape of the land cycle, bond market and stock markets are strikingly similar.
The big question is, have yields topped?
Looking at US long dated bond collaterals (bond collaterals up = bond yields down), we can see they currently sit within their 7.5 year cycle low timing window, looking to confirm a major pivot, paving the way for (at the very least) a short period of upside in bonds, and therefore downside in yields and interest rates.
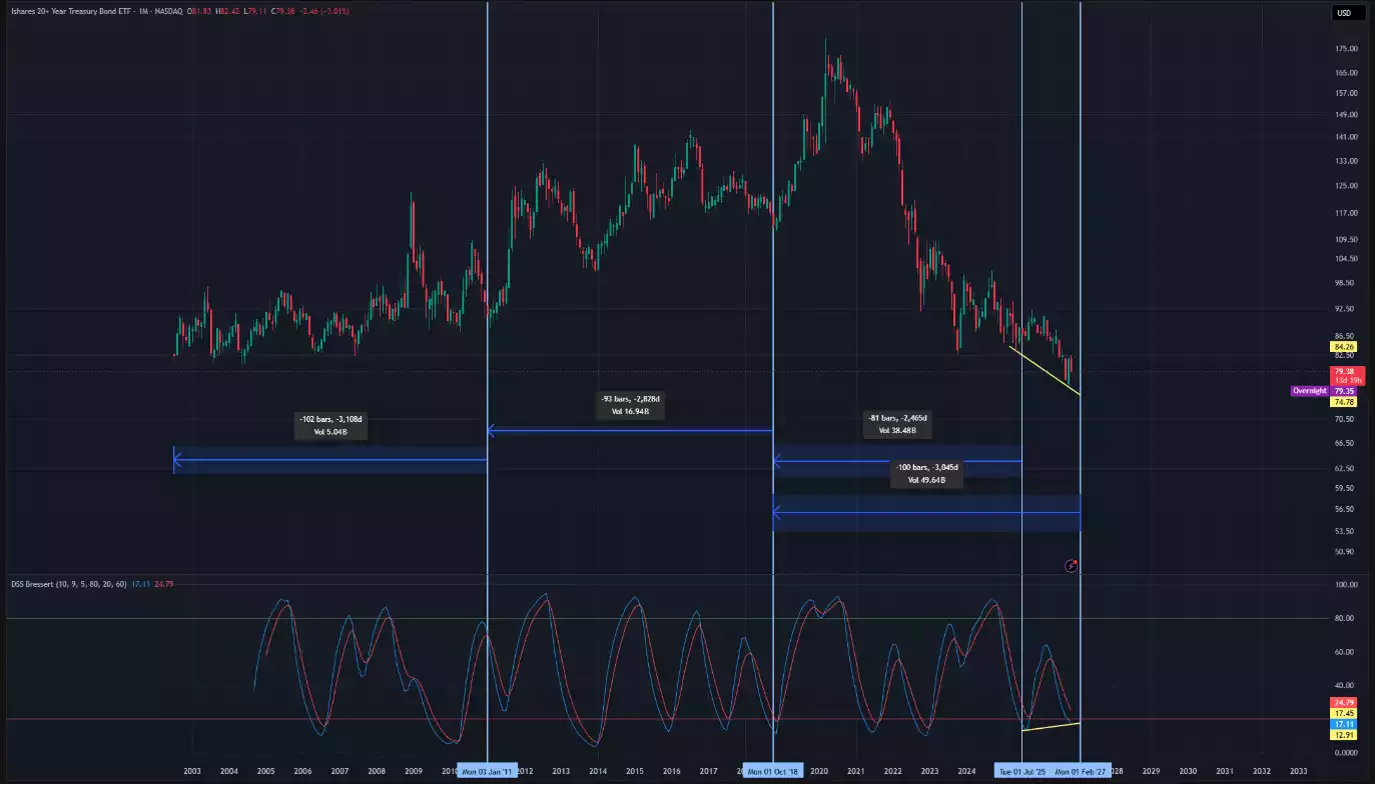
A swing low pattern, with a DSS bullish cross would confirm this macro low, and establish a (at the very least, short term) regime of falling yields and interest rates.
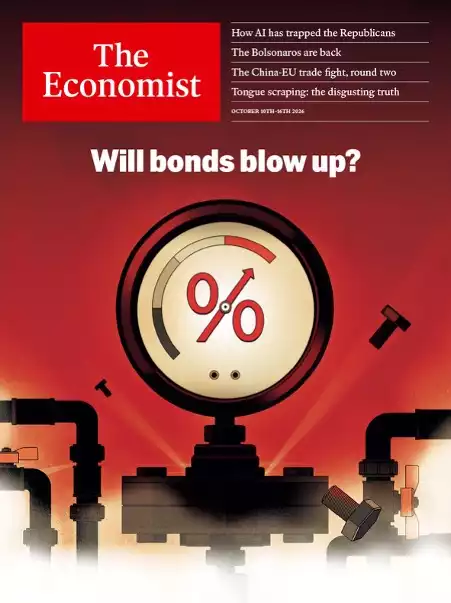
Meanwhile, sentiment on bonds is deeply negative, with negative mainstream media attention adding further confluence that we're at a macro low, and turning point. The Economist's 10 October 2026 cover, "Will bonds blow up?", is the kind that has often worked as a contrary indicator (Yardeni QuickTakes, 10 October 2026).
The counter case is that the top is not yet confirmed: the 10 year yield fell to 4.84% on 5 November but was back at 5.10% by 17 November, with central banks still hawkish. A move back above the 5.33% high would break the GFC timing guide.
What could falling yields mean for gold and silver?
While this short term turbulence affects all assets, the GFC precedent shows gold and silver pulling back for a very short period, followed by strong rallies.
While gold and silver have performed very well in the first half of their macro 8 year cycle (which started in 2022), within a high yielding, high interest rate environment (which is typically not conducive to precious metals outperforming), if the second half of the macro 8 year cycle transpires in a low rate, low yield environment, it would throw gasoline on the macro bull runs for gold and silver, as they emerge from their macro half cycle lows this year (4 years into the 8 year cycle).
Moreover, looking at silver's 8 year cycle profile, it tends to put in 2 consecutive bullish right translated (peak to the right of the 4 year midpoint) 8 year cycles, followed by a bullish left translated (peak to the left of the 4 year midpoint) one. Currently in the second 8 year cycle in this series, silver could be set up for a strong move out of 2026, purely from a cycle profile point of view, adding further confluence to outperformance amid volatility.
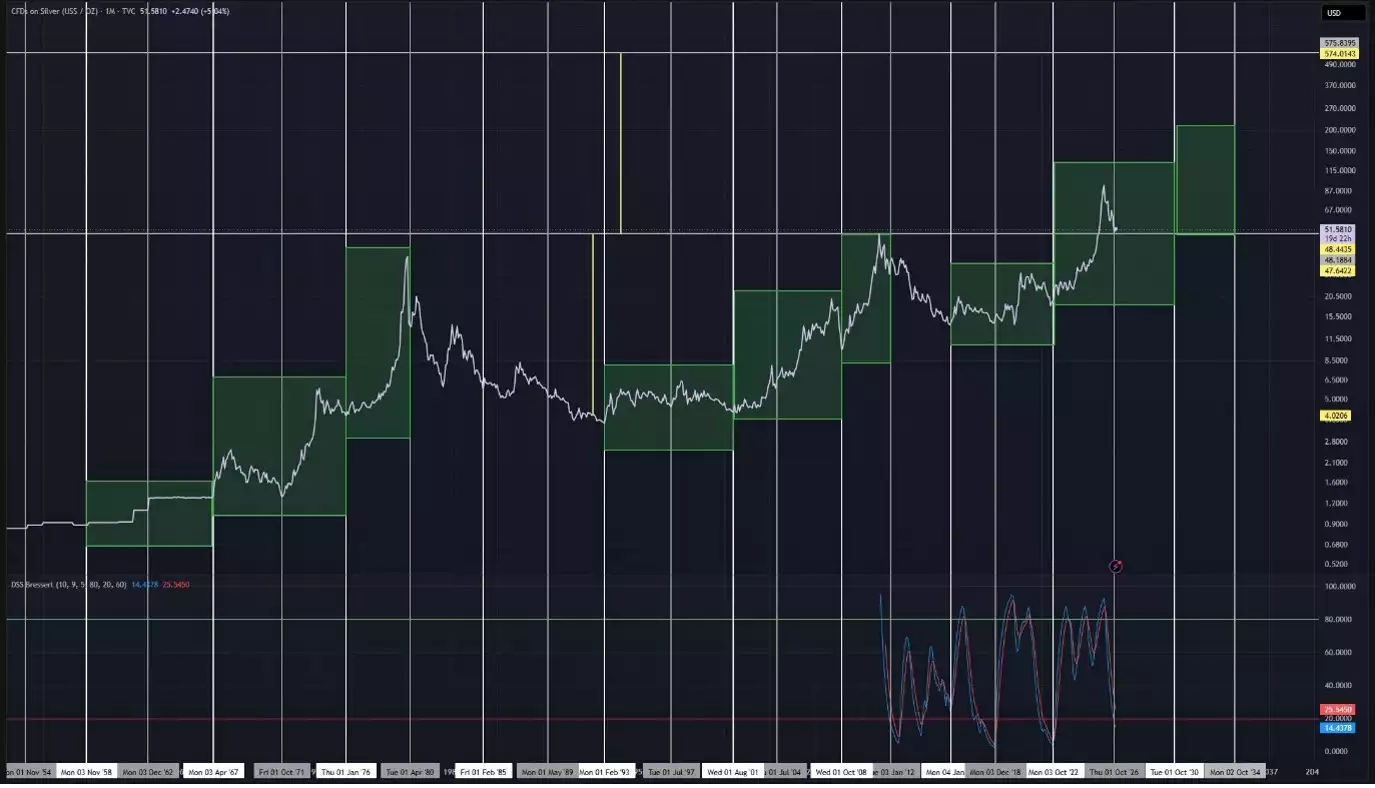
This primes 2027 to potentially be a notably strong year for precious metals, amid broad based turbulence.
Ainslie Bullion has been helping Australians hold physical gold and silver since 1974, and a cycle measured in years tends to reward accumulating through it rather than timing a single entry.
_______________________________________________
This article is general information only and does not constitute financial advice. Past performance is not indicative of future results. Always conduct your own research or consult a licensed financial adviser before making investment decisions.