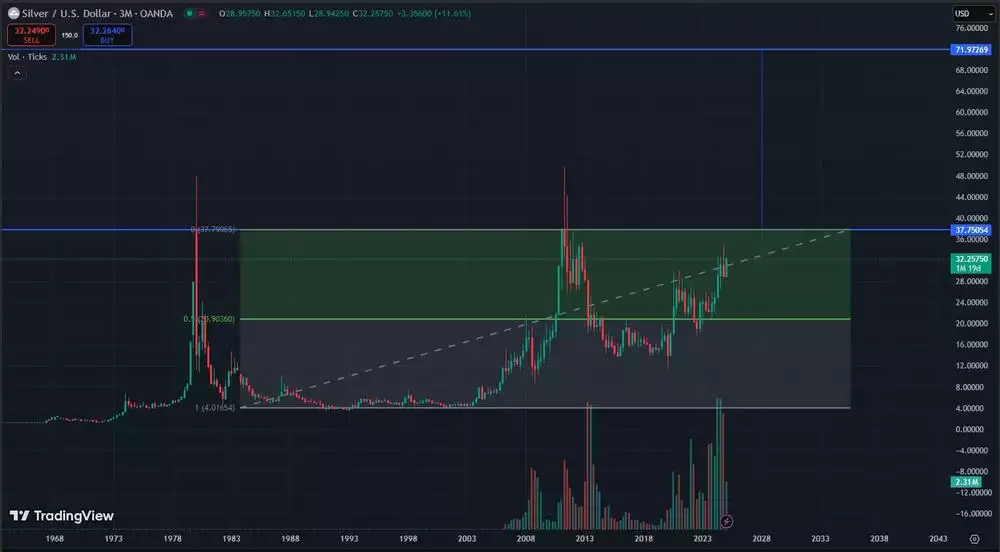
The 45-Year Silver Pattern
News
|
Posted 06/05/2025
|
3643
Bullion investors have watched in awe as gold has torn a path to new highs over the past few weeks. Silver is historically underpriced compared to gold, but at its core, it is a monetary metal and tends to track with it, although in more volatile moves. For traders and technical investors, the combination of silver’s 45-year culminated ‘cup and handle’ formation and a gold-to-silver ratio (GSR) exceeding 100:1 spotlight silver’s undervaluation and breakout possibility and signals the potential for significant price appreciation.
Silver's technical chart reveals patterns that often repeat. The cup and handle pattern began forming post-1980 after silver’s Hunt Brothers-driven spike to US$50 per oz. The ‘cup’ spans from 1980-2011, with a left lip at US$50, a base near US$4 (1986–2004), and a right lip at US$49.82 (2011). The subsequent ‘handle’ consolidated between 2011 and 2023, with prices moving between US$12 and US$31. Visible on monthly and yearly charts, this 45-year formation reflects a lengthy accumulation phase. A significant breakout above US$31-32 in 2024 supports the pattern’s completion and projects a slingshot move higher to a target of US$130–150.

The GSR, currently over 100:1, amplifies this bullish case. Historically, ratios above 100 signal silver’s undervaluation relative to gold, often preceding silver’s outperformance. For instance, during silver’s 2011 rally, the GSR compressed to 30:1 as silver surged. With gold near US$2,800, a reversion to a GSR of 50:1 implies silver at US$56, while a 30:1 ratio suggests US$93 - both plausible within the cup and handle’s target range. Silver plays two distinct roles — as both a monetary asset and an industrial metal. Its unique position is reinforced by strong industrial demand from sectors such as defence, solar energy, and electronics, as well as by safe-haven buying driven by concerns over fiat currencies.
Nevertheless, risks ease optimism. Silver’s volatility, driven by speculative flows and industrial cycles, could delay or disrupt the projected rally. Resistance at prior highs of US$38 and US$50 could challenge momentum, requiring catalysts like sustained US dollar weakness or supply constraints to break through.
Silver’s 45-year formation and the GSR exceeding 100:1, positions it well for a potential multi-year bull run. With historical precedents suggesting transformative gains, when you put silver’s technical indicators and fundamentals together, there’s a very bullish case for silver and all the reasons to capitalize on this rare opportunity.