Stocks Fly… But Look at This
News
|
Posted 02/11/2023
|
2258
The Fed interest rate decision happened last night as expected with no hike. The policy statement repeated that:
- The US banking system is strong and resilient.
- Inflation is still high; they need to attend to inflation risks.
- A need to return to 2%
The Bullish News
Global stock indices and the U.S. dollar index managed to sustain their gains, despite benchmark Treasury yields falling to a two-week low. This market movement followed the Federal Reserve's decision to maintain interest rates at their current range of 5.25% to 5.50%, while keeping the possibility open for future increases.
The Fed's policy statement recognized the unexpected strength of the U.S. economy. However, just like last time, it also acknowledged the challenges faced by businesses and households due to tighter financial conditions. Traders in short-term U.S. interest rates responded by increasing bets that the Fed has concluded its rate hikes and might initiate rate cuts by June.
The Dow Jones Industrial Average rose by roughly 105 points, while the S&P 500 gained 21 points (mostly from tech, while materials were the major losers). The Nasdaq Composite also saw an increase, adding just over 95 points. Could this rise continue? Perhaps it could.
A Bearish Scenario
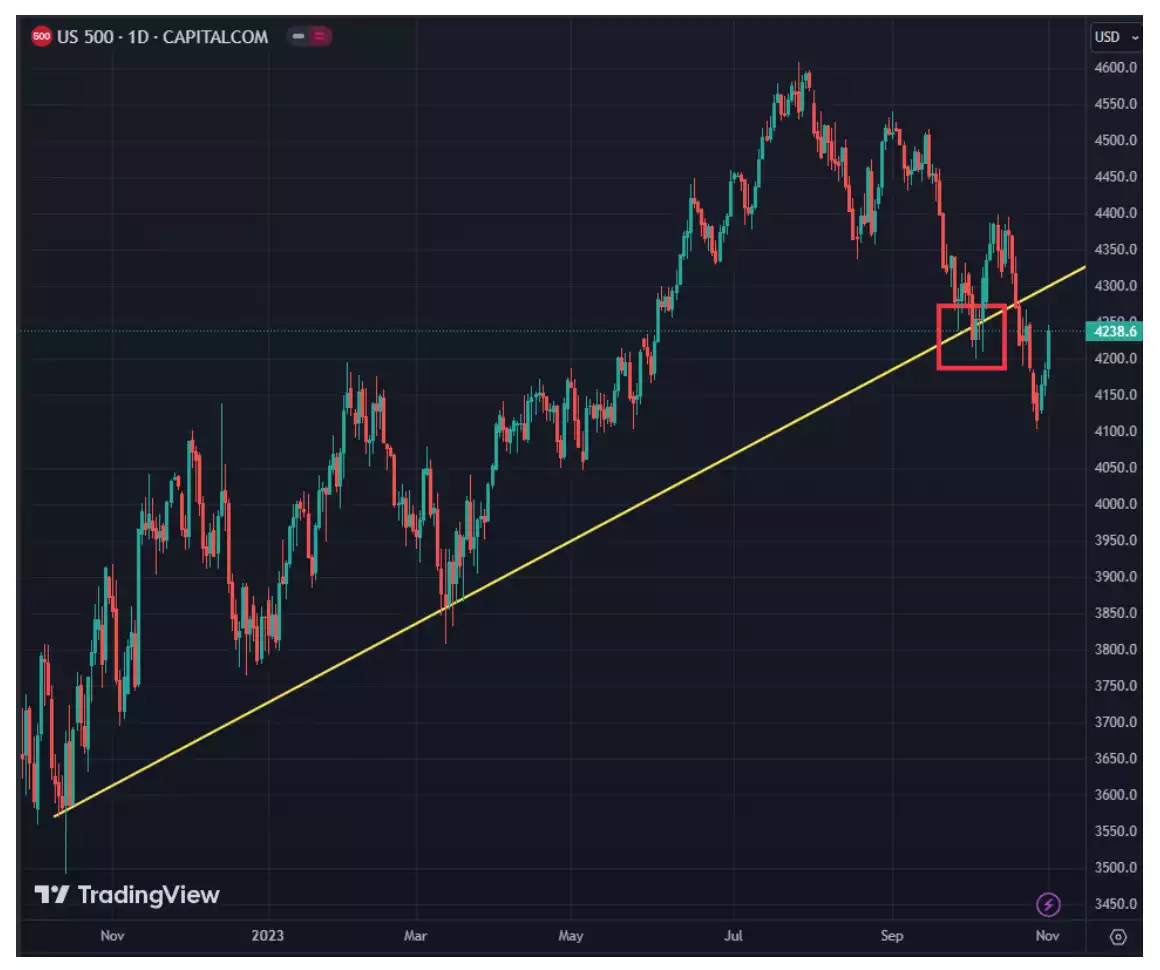
These stock market increases that happened the past couple days paint a rosy picture, but as mentioned previously, the beginning of October had the S&P 500 break a roughly 1 year trend line - a technical signal which predicted its aggressive fall throughout the second half of the month. Despite the stampede of positive news articles with emotionally-driven titles, the index fell, just as the textbook technical pattern called for.
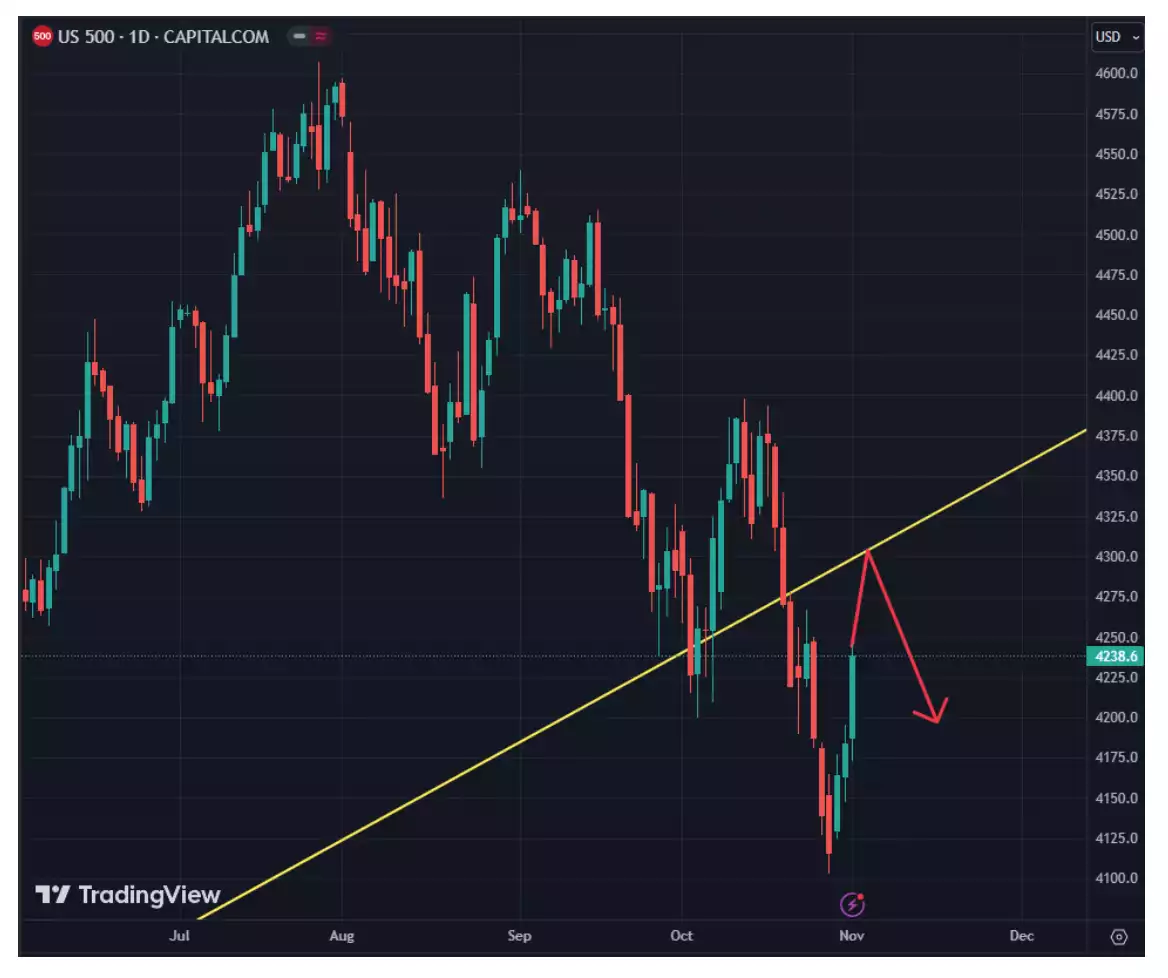
We now see the price has risen back up towards the trend line (in yellow). If one is looking for a scenario of another fall, a pattern that can happen after a trend line break is a retest from the bottom. Put simply, the yellow line was a floor and it may now be a ceiling which the price could ricochet off of. Below is an example of what a retest and rejection could look like (this is a scenario, not a guarantee).
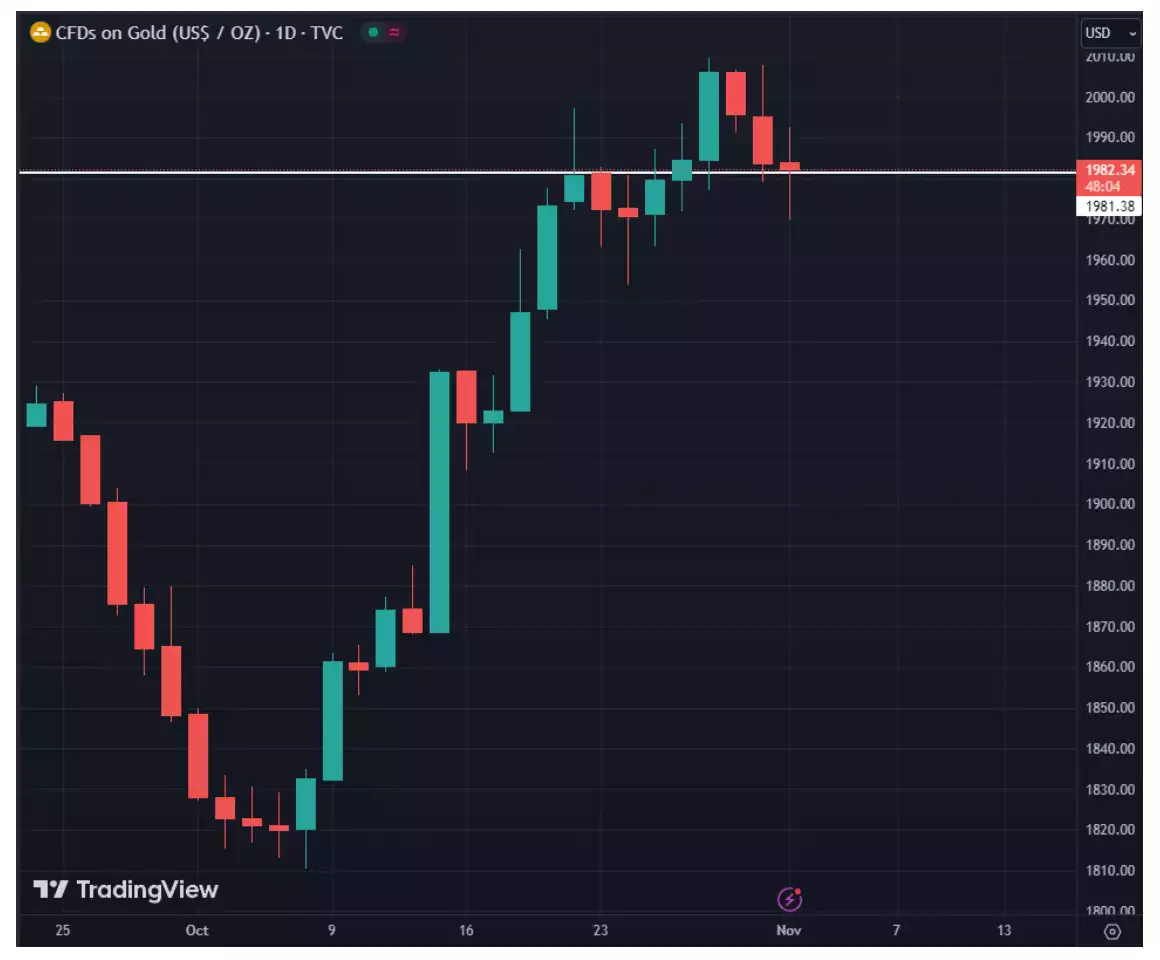
Gold/USD has so far managed to largely cling to its gains. The major level it is attempting to hold is 1981 (the white line below). Holding this line may be critical in the short-term, as there is not strong support directly underneath. There is also almost no resistance overhead, so successfully holding this level could be a good sign for further gains. The gold price would still have to rise over 5% to reach its all-time-high as Gold/AUD did recently.